Saturday, June 23, 2018

Bureaucrats Shut Down Your Kids’ Lemonade Stands? Country Time Will Pay the Fines.

Bureaucrats Shut Down Your Kids’ Lemonade Stands? Country Time Will Pay the Fines.

A summer promotion will cover fines and fees when your local code enforcers come calling.

Every summer, it seems, brings a parade of outrageous stories about petty local officials who shut down kids' front-yard lemonade stands because the little moppets don't have the right permits. But this summer things might be different as civil disobedience meets corporate marketing. Young lemonade entrepreneurs are getting some support against local bureaucrats from powdered lemonade manufacturer Country Time.
This morning the company launched an ingenious summer promotional campaign. Country Time wants your kids to open lemonade stands. If some stiff suit from city hall comes calling, Country Time will help you out by covering the costs of fines and permit fees:
This promo site provides the details. To take advantage of the offer, you need to be the parent of a child 14 or younger who has a lemonade stand. Country Time will cover fines or fees up to $300 per child. The company has budgeted $60,000, enough to help at least 200 kids, for the program, which runs through August. But the tweet says Country Time is prepared to create a fund of up to $500,000 to help more kids in future summers.
Country Time has an obvious agenda here: More lemonade stands potentially means more people purchasing and consuming its product. But the promotional stunt is a reminder that these meddling local officials are not protecting public safety but interfering in people's lives for stupid reasons and demanding to be paid for the service. Kudos to Country Time for trying to discourage this awful behavior, although in some cases $300 might not be enough to cover rapacious city permitting demands.

Friday, June 22, 2018

90 percent of MAPE — represented job classifications have a pay range, that is — on average — 7.8 percent above the market rate.”


Marin public employees’ union authorizes strike


County employees demonstrate during a rally at the Marin County Civic Center in San Rafael on May 22. (Richard Halstead/Marin Independent Journal)
County employees demonstrate during a rally at the Marin County Civic Center in San Rafael on May 22. (Richard Halstead/Marin Independent Journal) 


The Marin Association of Public Employees, the union that represents a majority of Marin County’s public employees, has voted to authorize a strike.
The vote was taken last week and ballots were counted late on Friday. Rollie Katz, executive director of the Marin Association of Public Employees, said 654 of the union’s members voted in favor of a strike authorization and 47 voted not to authorize a strike.
The union represents 1,471 of the county’s 2,740 employees. Only 1,280 of the employees represented by the union are members, however; the remaining 191 are fee payers who are entitled to representation but do not enjoy the privileges of membership.
“It’s a pretty strong statement by the members,” Katz said.
The vote authorizes the union’s 15-member bargaining team to call a strike if they deem it necessary. The team is made up of rank-and-file members elected by the full membership. Katz said no date for a strike has been set at this time.
“We hope we don’t have to strike,” Katz said, “but this vote is a very clear sign to the Board of Supervisors that they need to get management to move off of some of their positions and find a resolution.”
The two sides began working with a state mediator on June 13. The next meeting with the mediator is scheduled for June 25.
At last report, Marin County and MAPE were at loggerheads over a new three-year contract.
The county had proposed wage increases of 2.5 percent, 2.5 percent and 2 percent over each of the next three years. The union countered with a proposal for wage increases of 3.5 percent, 4 percent and 3.5 percent.
In addition to the dispute over pay raises, county managers and MAPE are at odds over several changes the county is seeking that could result in significant pay reductions for some lower-paid county employees.
“I can’t talk in detail about what has happened in mediation,” Katz said. “We’ve got a few smaller items off the table, but none of the make-or-break proposals. Nothing has happened that would move the needle significantly.
“We would hope there would be further movement in bargaining,” Katz said. “We’re certainly prepared to compromise. We have been offering compromises.”
There has been speculation that if MAPE calls a strike, other county unions, including the Marin County Management Employees’ Association, might stage a sympathy strike or work slowdown.
Katz said, “My expectation is that if we have a strike a number of other workers, including MCMEA, will be very supportive.”
The last time Marin County employees went on strike was the summer of 1998. At that time, MAPE was seeking a 10 percent wage increase over two years. County managers started out offering a 7.5 percent wage hike over three years. At the end of the seven-day strike, however, the county agreed to a contract that gave employees a 10.5 percent wage increase over three years.
As of July 2017, 55 percent of Marin County’s employees lived outside of Marin. Many say they can’t afford Marin housing prices.
Mary Hao, Marin County’s director of human resources, said Marin County recently conducted a survey of salaries across the Bay Area, including San Mateo, Napa, Solano, Sonoma, Alameda and Contra Costa counties; the city and county of San Francisco; and the cities of Novato, Berkeley, Santa Rosa, San Rafael, Vallejo and Palo Alto.
“This cross sampling helps us determine the market rate for the same or similar jobs in those collective areas, based on median of the pay in these jurisdictions versus average,” Hao wrote in an email. “What we discovered in our research was that 90 percent of MAPE — represented job classifications have a pay range, that is — on average — 7.8 percent above the market rate.”

Pervasive Suburbanization: The 2017 Data

Pervasive Suburbanization: The 2017 Data

The most recent Census Bureau population estimates have made it clear that migration to the suburbs and away from urban cores has accelerated dramatically since the early years of the Great Recession (see here and here). More detailed national data, from the Current Population Survey (CPS) indicates that moving to the suburbs is pervasive (CPS is a joint program of the Census Bureau and the Bureau of Labor Statistics). The CPS data is much higher level geographically than similar data Census Bureau and Internal Revenue Service migration, providing no state, county or metropolitan area breakdowns. CPS data is national, and divided further into the 4 regions (Northeast, Midwest, South and West) and nine divisions (New England, Mid-Atlantic, East North Central, West North Central, South Atlantic, East South Central, West South Central, Mountain and Pacific).

Domestic Migration: Plus 2.3 Million to Suburbs, Minus 2.3 Million from “Principal Cities”

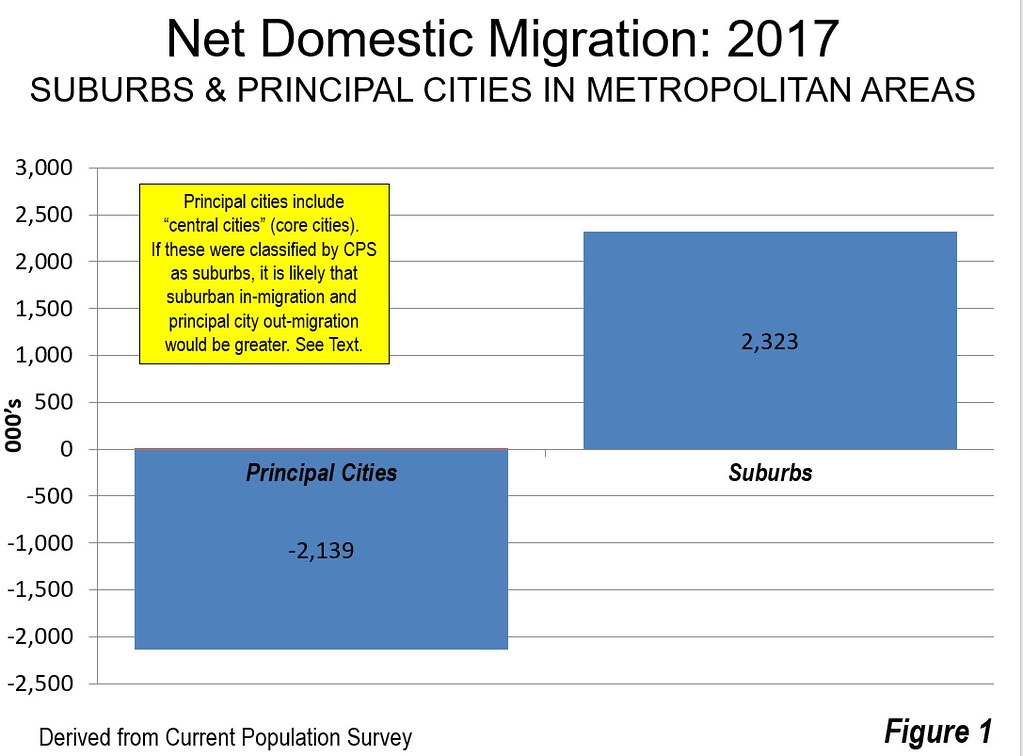
Between 2016 and 2017, more than 2.3 million (net) US residents moved into what the CPS classifies as. “suburbs.” At the same time, 2.3 million (net) moved away from “principal cities,” with most of their population in those classified as “central cities” (urban core cities) before 2003 (Figure 1). In fact this approach probably under-estimates the extent of migration into suburbs and out of the urban cores of metropolitan areas. This is because many principal cities are, in fact suburbs whose high employment levels, not their overwhelmingly suburban and automobile oriented urban form, determines their classification. For example, suburban principal cities, such as Plano, Texas, Mesa, Arizona, Bellevue, Washington, Sandy Springs, Georgia, and many others are likely to be not losing domestic migrants, while the suburbs with smaller employment bases around them are gaining. Indeed, many non-historical core principal cities did not even exist when the great post-World War II automobile -oriented suburbanization started and were some were primarily rural into the 1960s.
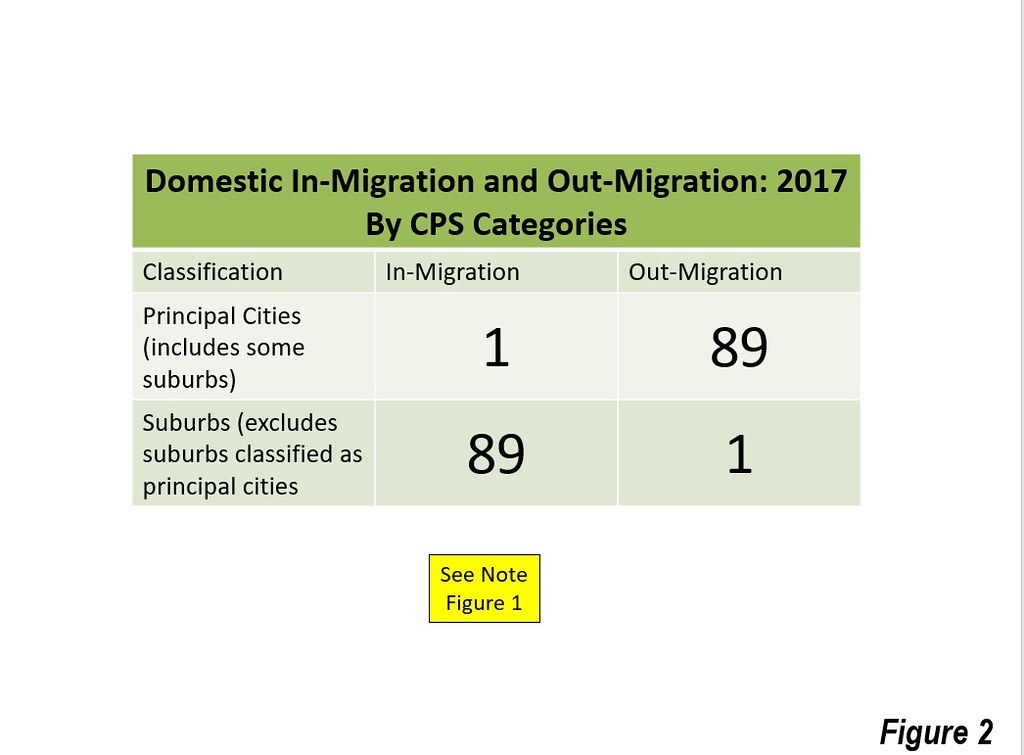
The move to the suburbs was so pervasive that CPS found gains in 89 of 90 categories. The principal cities, on the other hand lost in 89 of 90 categories (Figure 2), which are organized into total, sex, age, race and Hispanic origin, relationship to householder (formerly called “head of household), educational attainment, marital status, nativity, tenure, poverty status, income, labor force status, major occupation and major industry.
This article summarizes some of the most important findings from the latest CPS data.

Millennials: Moving to the Suburbs

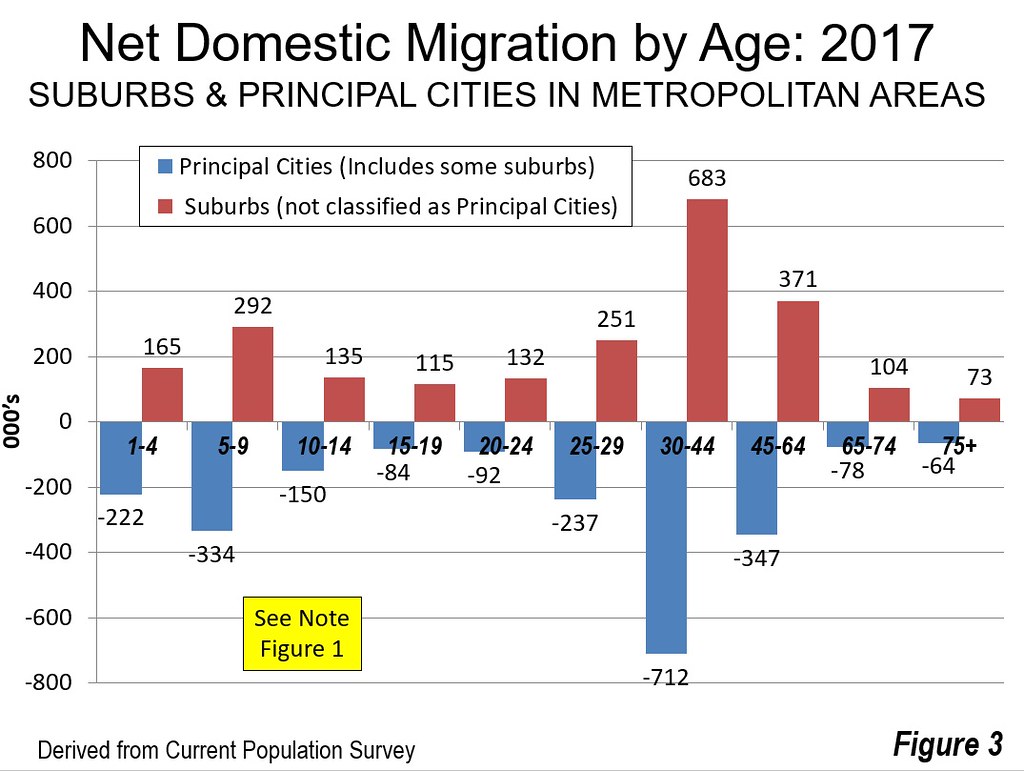
One of the most enduring urban myths has been that millennials are rejecting the suburbs for the inner cities. We have previously shown that the largest percentage of millennial growth is in the suburbs not the urban core. According to CPS, those aged 20 to 29 are net moving in large numbers away from the principal cities, even including some largely suburban cities, (minus 329,000) and to the suburbs (plus 383,000)

All Other Ages: Moving to the Suburbs

Millennials are not alone. It is well known that the more family friendly characteristics of the suburbs attract people with young children. This is obvious by the 165,000 children aged 1 to 4 who are moved to the suburbs by their parents, compared to the 222,000 who are moved away from the principal cities (the balance of 57,000 were moved to non-metropolitan areas).
An even bigger gap is noted among children aged 5 to 9, 292,000 of whom were moved to the suburbs compared to the 334,000 moved away from the principal cities (and the 42,000 moved to non-metropolitan areas). This is consistent with the perception that core cities generally have inferior public schools, inducing parents to move to the suburbs or beyond when it comes time to enroll their children in schools.
The largest suburban advantage occurs in the 30 to 44 age category, when households are often starting families. Suburbs attract an astounding 683,000 domestic migrants in this category, while the principal cities lose 712,000. The suburban gains continue, but at a lower rate, as people reach 45 to 64 years of age. Suburbs gained 371,000 net domestic migrants, while principal cites lost 347,000.
The often suggested view that retirees are flocking to the inner cities is countered by the reality that in 2017, 104,000 aged 65 to 74 moved to the suburbs, while 78,000 moved away from the principal cities. The numbers moving are small since older people are increasingly aging in place, which for most is in the suburbs.
In every age category, then, the suburbs gain net domestic migrants, while the principal cities lose (Figure 3).

Minorities: Moving to the Suburbs

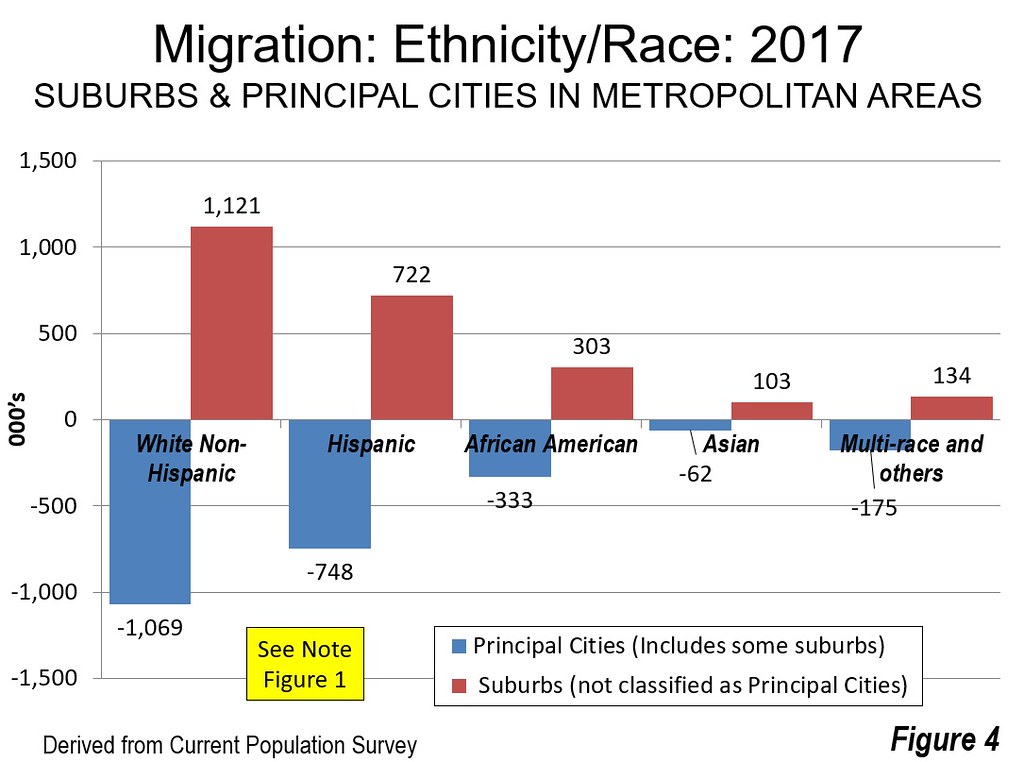
Perhaps the most important trends relate to ethnicity and race. The early post-World War II suburban migration might be characterized as “white flight,” but in recent decades minorities have been migrating to the suburbs. It is no surprise that White Non-Hispanics migrated strongly to the suburbs (plus 1,121,000) and away from the principal cities (minus 1,069,000). But Hispanics migrated even more strongly to the suburbs (plus 722,000) and away from the principal cities (minus 748,000). Similarly, African-Americans migrated to the suburbs (303,000) and away from the principal cities (minus 333,000). Asians, though a much smaller share of the population, also chose the suburbs overwhelmingly (plus 103,000) and abandoned the principal cities (minus 62,000).
Overall, among those who are minority or mixed race, 1.3 million moved to the suburbs, while 1.3 million moved away from the principal cities (Figure 4).

All Levels of Educational Attainment: Moving to the Suburbs

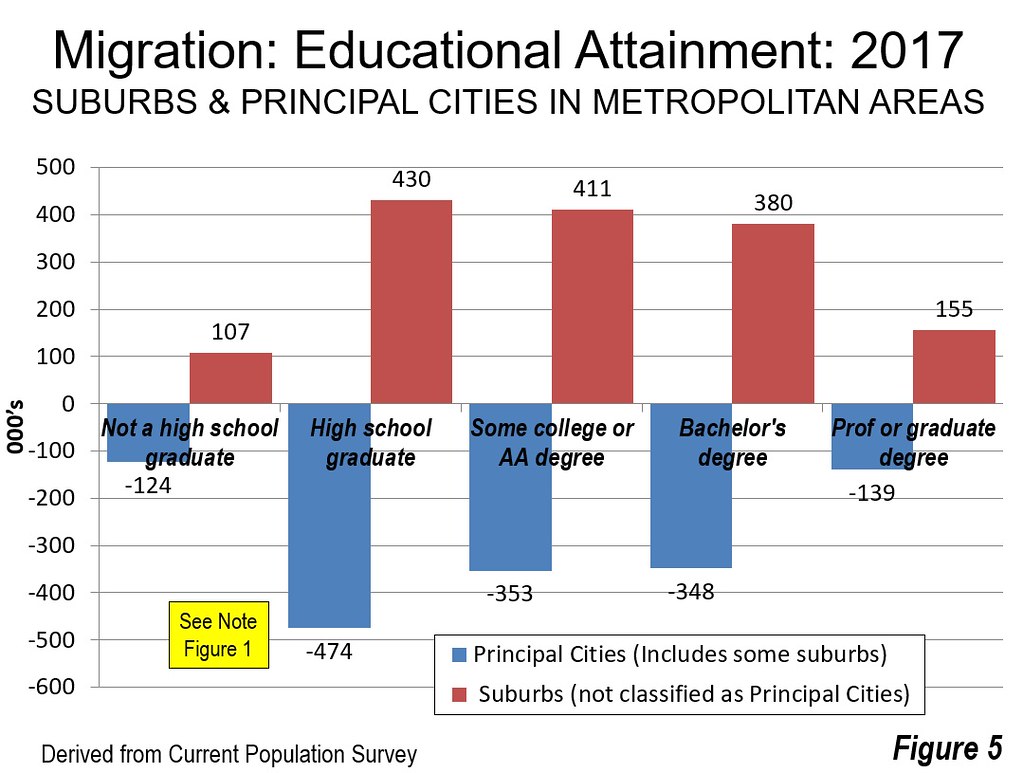
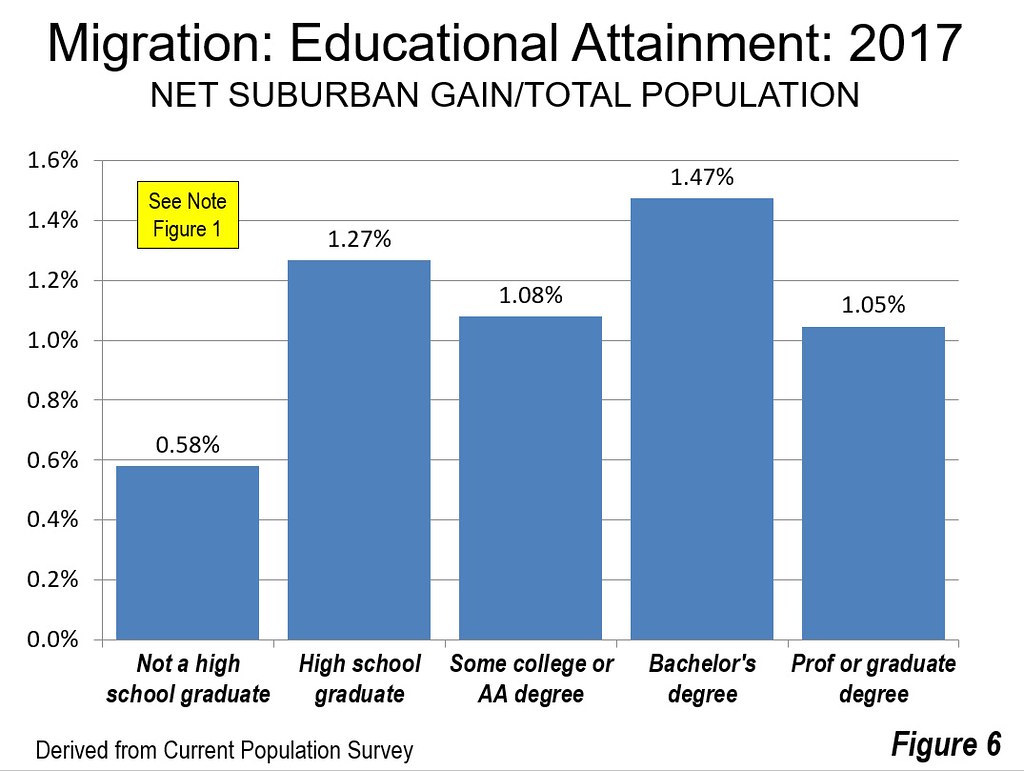
Regardless of educational attainment, net domestic migration is positive to the suburbs and negative to the principal cities (Figure 5). In relation to the total population of the educational attainment categories, the largest suburban over principal city gain was among those with bachelor’s degrees, while the smallest was among those without high school educations (Figure 6).

All Income Levels: Moving to the Suburbs

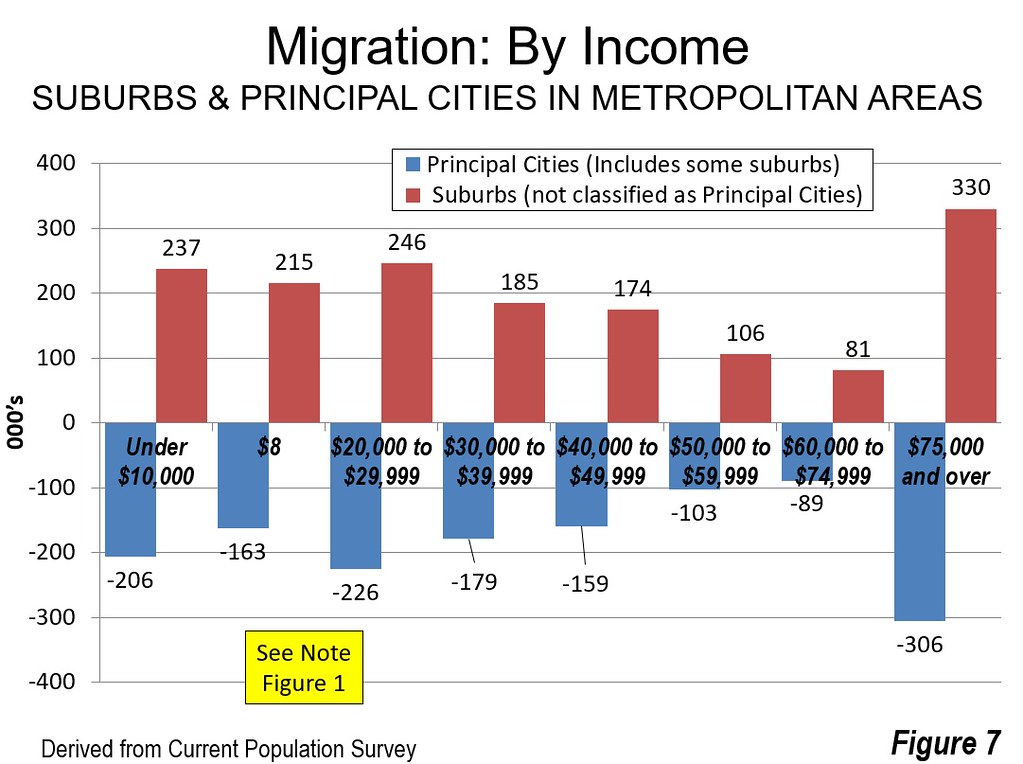
People of all income levels are moving to the suburbs. The highest income category shows the most significant movement into the suburbs and away from the principal cities (Figure 7)

Regardless of Poverty Status: Moving to the Suburbs

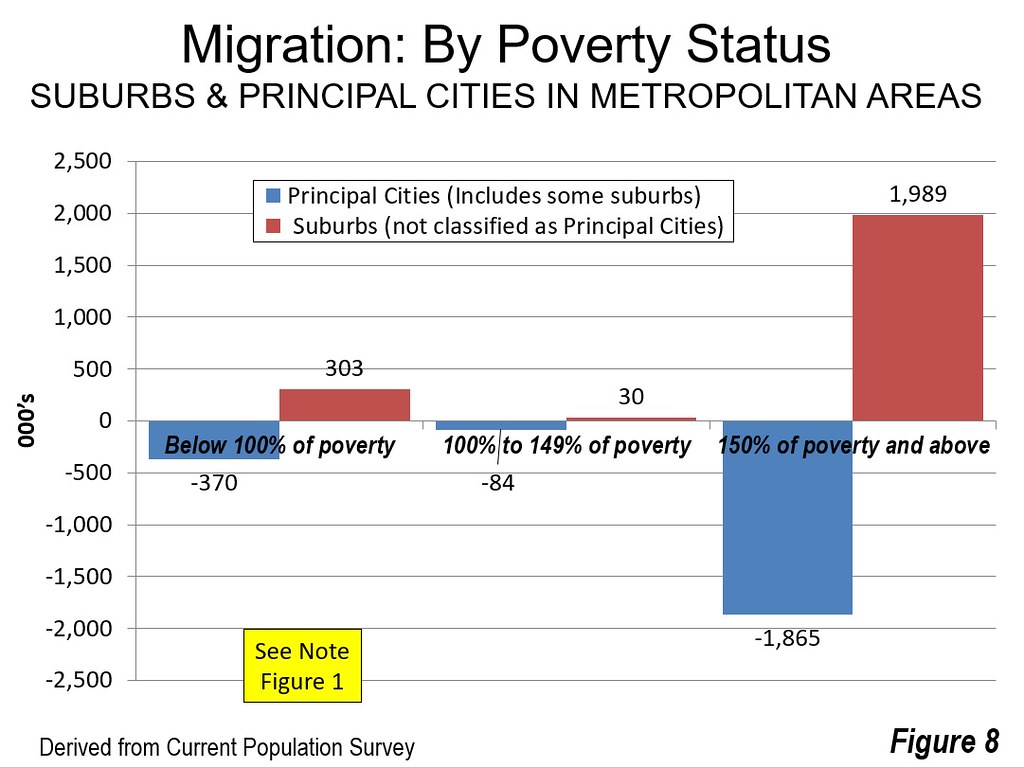
Both people above and below the poverty line exhibited strong net domestic migration to the suburbs and away from the principal cities. Approximately 85 percent of domestic migrants to the suburbs were above the poverty line (Figure 8). Our last review of central city versus suburban poverty showed that urban core poverty rates were double those of the suburbs.

Native Born and Foreign Born: Moving to the Suburbs

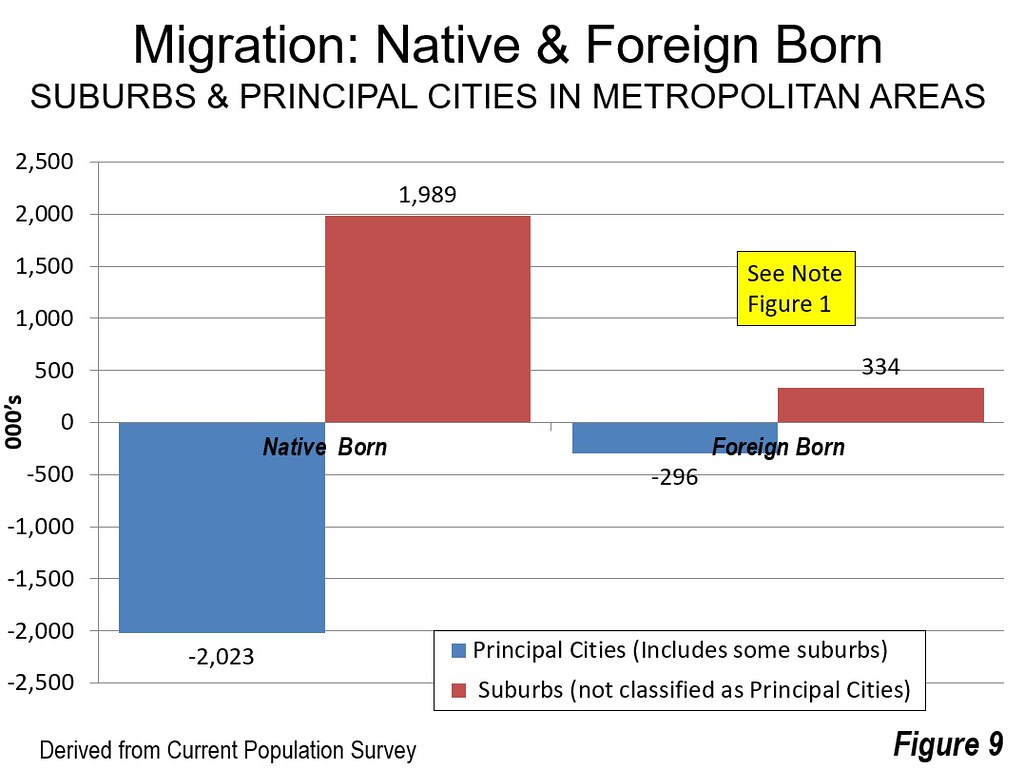
Both the native born and foreign born population exhibited strong net domestic migration to the suburbs and away from the principal cities (Figure 9).

Why People Continue to Move to the Suburbs

CPS summarizes reasons for moving, indicating that 43.0 percent of moves are housing related, 27.9 are family related, and 18.5 percent are employment related. Other reasons account for 10.6 percent. Housing related reasons would include moving to larger houses with yards, especially for their children. Family reasons would include households moving to school districts perceived likely to provide better educations to their children. Finally, employment reasons doubtless includes many households that move to be closer to jobs. All of these reasons favor the suburbs, where the houses are bigger and more spacious, where schools are perceived to be better and where 80 percent of the jobs are located.
Wendell Cox is principal of Demographia, an international public policy and demographics firm. He is a Senior Fellow of the Center for Opportunity Urbanism (US), Senior Fellow for Housing Affordability and Municipal Policy for the Frontier Centre for Public Policy (Canada), and a member of the Board of Advisors of the Center for Demographics and Policy at Chapman University (California). He is co-author of the “Demographia International Housing Affordability Survey” and author of “Demographia World Urban Areas” and “War on the Dream: How Anti-Sprawl Policy Threatens the Quality of Life.” He was appointed to three terms on the Los Angeles County Transportation Commission, where he served with the leading city and county leadership as the only non-elected member. He served as a visiting professor at the Conservatoire National des Arts et Metiers, a national university in Paris.

Thursday, June 21, 2018

Stop Trying to Get Workers Out of Their Cars

Stop Trying to Get Workers Out of Their Cars

"Smart growth" is dumb about commuting.

If you hate urban sprawl, you're probably familiar with the complaints of the "smart growth" movement: Roadways blight cities. Traffic congestion is the worst. Suburbanization harms the environment. Fortunately, say these smart growthers, there is an alternative: By piling on regulations and reallocating transportation-related tax money, we can "densify" our urban communities, allowing virtually everyone to live in a downtown area and forego driving in favor of walking or biking.
Smart growth proponents have been gaining influence for decades. They've implemented urban growth boundaries (which greatly restrict the development of land outside a defined area), up-zoning (which tries to increase densities in existing neighborhoods by replacing single-family homes with apartments), and "road diets" (which take away traffic lanes to make room for wider sidewalks and bike lanes).
Alas, there are inherent flaws in the "smart growth" approach—beginning with the idea that it makes sense for everyone to live and work in the same small area. In fact, that idea flies in the face of what economists call urban agglomeration.
Urban agglomeration is why there are more jobs in and around big cities. Job seekers have access to a large number of potential employers, which increases each person's likelihood of finding one that can make the best use of her unique talents and skills. The same is true for business owners, who have a much better chance of finding people in a large populous urban area who match their needs.
Transportation turns out to be a key factor in enabling these wealth-increasing transactions. Imagine drawing a circle around the location of your residence, defined by how far you are willing to commute to get to a satisfying job. The larger the radius of that circle, the more potential work opportunities you have. Likewise, a company's prospective-employee pool is defined by the number of people whose circles contain that company's location.
Most people measure that radius in time rather than distance; studies show they are generally unwilling to spend much more than 30 minutes commuting each way on a long-term basis. That means the size of their opportunity circle is critically dependent on how quickly they can get around.
Despite urban sprawl and ever-increasing congestion levels, economists Peter Gordon and Harry Richardson of the University of Southern California have documented, using census data, that average commute times in various metro areas have hardly changed at all over several decades. More recently, Alex Anas of the University of Buffalo modeled what would happen as a result of a projected 24 percent increase in Chicago's metro area population over three decades. He estimated that auto commute times would increase only 3 percent and transit trip times hardly at all. The reason is that people tend to change where they live or work in order to keep their travel times about the same. But this happy result comes about only if the transportation system expands accordingly.
A recent empirical study from the Marron Institute of Urban Management at New York University likewise found that, on average, the labor market of an urban area (defined as the number of jobs reachable within a one-hour commute) nearly doubles when the workforce of the metro area doubles. The commute time increases by an average of only about 7 percent, however—assuming an efficient region-wide transportation network. To achieve higher economic productivity, they recommend fostering speedier rather than slower commuting; more rather than less commuting; and longer rather than shorter commutes.
These policies would expand the opportunity circles of employers and employees, enabling a more productive urban economy. But these are exactly the opposite of the policy prescriptions of smart growth, which generally seek to confine people's economic activity to a small portion of a larger metro area.
One early manifestation of this was the attempt by urban and transportation planners in the '80s and '90s to promote "jobs-housing balance," where each county of a large metro area has comparable percentages of the region's jobs and of its housing. The rationale was that this would reduce "excessive" commuting by enabling people to find work close to their homes. But urban agglomeration theory makes it clear that that is a recipe for a low-productivity urban economy. Census data show that many suburban areas are now approaching jobs-housing balance on their own, but this does not necessarily reduce commute distances—to get to the jobs they want, many people still travel across boundaries.
A fascinating example is Arlington County, Virginia. Since 2000, the number of jobs and the number of working residents in the county have been approximately equal. But it turns out that only 52 percent of those working residents have jobs in the county. Out of 582,000 resident workers, 280,000 commute to adjacent counties or the District of Columbia. And out of 574,000 jobs in the county, 272,000 are filled by workers from other places.
A less extreme version of smart growth says that we should discourage car travel and shift resources heavily toward transit. People should be encouraged to live in high-density "villages" where they can easily obtain transit service to jobs elsewhere in the metro area. The problem with this vision is the inability of transit to effectively compete with the auto highway system.
Simply put, cars work better for workers. A 2012 Brookings study analyzing data from 371 transit providers in America's largest 100 metro areas found that over three-fourths of all jobs are in neighborhoods with transit service—but only about a quarter of those jobs can be reached by transit within 90 minutes. That's more than three times the national average commute time.
Another study, by Andrew Owen and David Levinson of the University of Minnesota, looked at job access via transit in 46 of the 50 largest metro areas. Their data combined actual in-vehicle time with estimated walking time at either end of the transit trip, to approximate total door-to-door travel time. Only five of the 46 metro areas have even a few percent of their jobs accessible by transit within half an hour. All the others have 1 percent or less. Within 60 minutes door-to-door, the best cities have 15–22 percent of jobs reachable by transit.
Meanwhile, Owen and Levinson found that in 31 of the 51 largest metro areas in 2010, 100 percent of jobs could be reached by car in 30 minutes or less. Within 40 minutes, all the jobs could be reached by car in 39 of the cities. Within an hour, essentially every job in all 51 places could be reached by car. The roadway network is ubiquitous, connecting every possible origin to every destination. The contrast with access via transit—let alone walking or biking—is profound.
Photo Credit: thomas-bethge/iStock

    Why Marinwood Park needs a natural landscaping plan. Photos tell the story.


    The Marinwood Park Maintenance Area occupies over an acre of Marinwood Park that could be better used for a playground or a picnic area.  It resides on the bank of beautiful Miller Creek

    Rusting equipment trucks and trailers are parked everywhere.  Large piles of landscaping waste are stored thoughtlessly.

    Even the bulk storage of materials is unkempt.

    Workers drive vehicles in the grasslands on the nature trail oblivious to the beautiful animals, wildflowers and grasses they crush.   Why couldn't the vehicle wait for the walker to pass before proceeding?  Instead the soil becomes compacted from years of poor landscaping practices.

    A more beautiful Marinwood Park can become reality and it really doesn't take much more effort than adhering  to a policy of sound landscaping practices for open space.   Trails don't need to be wider than a single vehicle.  Over time, the landscape will recover and beauty will be restored.

    We love our park.  Kids love to play in Miller Creek.  We need to make MAKE BEAUTY a PRIORITY and store our essential vehicles in a practical facility like  other parks in Marin.

    A practical shed like this is the standard for most communities in Marin County. They cost a tiny fraction of the proposed maintenance shed for Marinwood Park which if built will be the MOST EXPENSIVE IN MARIN COUNTY. The cost savings can be invested in better facilities elsewhere in the Park.

    We don't need much.  Just a little love for Marinwood Park.


    A beautiful natural playground next to Miller Creek can be built for our children. 
    Isn't this a better use of our park than rusty equipment and landscaping waste?


    Wednesday, June 20, 2018

    Photographs of the Toxic waste site known as the Eastern Hot Spot behind Prosperity Cleaners in Marinwood Plaza


    A series of groundwater testing sites first established in 2007 revealed high level of contamination.
    The wells are located a few feet from the chainlink fence. On the other side is Caltrans Right of Way (Miller Creek Ave. Southbound on ramp.)

    The door on the right is the back door to the room where the dry cleaning machinery was kept.  A toxic hot spot was found underneath the machinery and excavated to 15 feet in 2017.  Toxic waste was discovered at a depth greater than 35' ( below the water table).  Treatment was administered in 2017 which dropped toxic levels but still it is above residential standards. The toxic soil vapor remains a threat to Casa Marinwood and workers inside Marinwood Plaza.

    The second door to Prosperity Cleaners has been boarded up  and debris remains after work in 2017.

    A view from Caltrans property to that shows the toxic hotspot in the foreground and you can make out the back door to Prosperity Cleaners in the background. 

    When the workers in the Prosperity Cleaners plant cleaned machinery, they would dump the buckets of liquid containing toxic PCE into the grassy area next to the chain link fence.  Although the toxic soil has been treated on the Marinwood Plaza side of the fence, there have been NO soil testing and treatment on the Caltrans property.  The discharger claims that the toxic soil has been fully treated but this is preposterous as the toxic waste would tend to run downslope through the chainlink fence and into the ground on both sides.  Unless both sides of the fence are tested and treated  there is NO ASSURANCE that the toxic waste has been fully treated. It may continue to generate toxic soil vapor and pollute the groundwater for DECADES.

    Toxic waste is very harmful to pregnant women, children and the immune compromised.  It is vital that ENVIRONMENTAL JUSTICE is served to protect the health of the most vulnerable.  Marinwood Plaza has been the site of two affordable housing proposals.  It almost got built last time when there was an attempt to cover up the toxic waste issue.  Fortunately, citizens uncovered the data and are now advocating on the behalf of the community, Casa Marinwood, St Vincents and Silviera Ranch.

    Budget trailer bills have become Christmas trees

    Budget trailer bills have become Christmas trees


    By Dan Walters | June 20, 2018 | Commentary


    As detailed in this space a few days ago, the Legislature is using a budget “trailer bill” to deprive voters of vital information about local government and school bond issues.

    The legislation, drafted without public hearings or other input, would suspend for two years a new law, which took effect on January 1, requiring proposed bond measures to reveal to voters how they would affect property tax bills.

    The local officials who sought the suspension apparently believe that revealing the tax consequences to voters would make them less likely to vote for bond issues.

    Sadly, however, it is not an isolated example of how the Capitol’s politicians are misusing trailer bills, meant to implement the state budget, to enact far-reaching policies that have virtually nothing to do with the budget, and without any of the traditional safeguards, such as waiting periods and public hearings.

    Take, for example, one provision in a trailer bill devoted mostly to the state’s health care services.

    It would make immense changes in how those believed to be mentally ill are treated in the criminal justice system, essentially making “diversions” out of the courts and into treatment much easier.

    It’s a serious topic that deserves to be treated seriously and, in fact, legislation to reform diversions was already moving through the Legislature with input from all of the authorities and outside interest groups.

    Suddenly, however, the trailer bill popped up late last week, short-circuiting the legislative process and drawing ire from the California District Attorneys Association both on its substance and its sneakiness.

    “Simply put, diversion would be available for any crime,” the prosecutors complained in a “budget alert,” adding, “Additionally there are no limits on the number of times someone can receive diversion under this scheme, nor would anyone be excluded based on their criminal history.”

    A broader example of how trailer bills are being misused is the one labeled “general government and public employment.”

    California’s public employee unions, who are joined at the hip with the Legislature’s dominant Democrats, are very worried about a pending U.S. Supreme Court case that would ban them from collecting partial dues from non-members.

    In anticipation of the decision, which is likely to be issued this month, union-friendly legislators have carried new laws to minimize its effects, such as requiring new employees to attend “orientation meetings” aimed at persuading them to join unions and giving unions access to employee contact information that no one else – especially anti-union groups – could have.

    The newest effort would make the location of those orientation meetings a secret, expand the ability of unions to seek deduction of dues, make it somewhat more difficult for employees to opt-out of payments and expand the public agencies whose workers are subject to dues deductions.

    The secret meeting provisions are drawing criticism from the California News Publishers Association (disclosure: CALmatters is a member), which zealously defends the state’s open records and open meeting “sunshine” laws. The CNPA calls it “a limitation on the public’s right of access with no discernible public benefit.”

    There are many other questionable provisions in the 26 budget trailer bills. They have become legislative Christmas trees, festooned with ornamental goodies for those with political pull that should be aired fully and publicly, not drafted in the dead of night and enacted with minimal notice.

    Miwok Archealogy Dig in Marinwood Park. Documents from Charles Slaymaker, PHD from the Marin County California Room


    Here is a video for your reference.  It is from the collection at the the California Room at Marin Civic Center.  It shows several documents including the Charles Slaymaker studies of Marinwood/Lucas Valley. 

    Architectural digs occurred throughout the valley and the recently commissioned study by Marinwood CSD barely mentions this.   Indian relics are regularly found throughout Marinwood park especially after rains.  Marinwood Park and Miller Creek school were home to several large settlements encompassing thousands of year of history.  It is fairly obvious given the geography and plant life why Marinwood Park would be so desirable. It is flat, has access to food, animals, materials for tools and trading, its close to the bay yet protected from harsh weather.

    There is a large midden  (burial mound) that is fenced in at Miller Creek middle school. A child's skull was discovered near it after a rainstorm around 2006 and was buried again after it was determined likely a Miwok child.

    In 1967, Marin County Supervisors made it a crime to disturb middens without express permission.  This was one of the first such laws in the United States.

    Marinwood/Lucas Valley has a long and interesting ethnographic history that is just beginning to be uncovered. We live in a rich and wonderful valley.


    Monday, June 18, 2018

    Teams ready to test pods in Southern California for futuristic Hyperloop transit system

    Teams ready to test pods in Southern California for futuristic Hyperloop transit system

    This Jan. 19, 2017 staff file photo shows the inside of the SpaceX hyperloop test track along Jack Northrop Drive in Hawthorne. Test pods will shoot down the tube, which is a small version of a proposed high speed long distance model. (Photo by Brad Graverson, Torrance Daily Breeze/SCNG)
    By SANDY MAZZA | Southern California News Group
    PUBLISHED: January 27, 2017 at 11:01 am | UPDATED: January 27, 2017 at 11:03 am


    Space visionary Elon Musk turns his gaze back to Earth this weekend as 30 engineering teams from around the world gather in the South Bay to bring a dose of reality to his futuristic ground transportation concept known as Hyperloop.

    A white three-quarter-mile enclosed tube along a Hawthorne street, near Musk’s SpaceX and Tesla plants, will be the focus of a competition in which the teams will test pod vehicles propelled inside a vacuum chamber.This Jan. 19, 2017 staff file photo shows the SpaceX hyperloop test track along Jack Northrop Drive in Hawthorne. (Photo by Brad Graverson, Torrance Daily Breeze/SCNG

    Musk introduced the transportation system in a 58-page white paper in 2013, suggesting that a Hyperloop could ferry pods full of passengers between Los Angeles and San Francisco at speeds up to 700 mph in just 30 minutes.

    While founder of SpaceX and Tesla decided not to start his own Hyperloop business, he encouraged others to do so — and several businesses are already planning to build Hyperloops overseas.

    Instead, Musk offered to host this student competition Friday through Sunday and open-source all the development work to help hasten commercial production of the new mass-transportation method. He chose to host the competition near his home base in Hawthorne, where for a year now the Hyperloop tube has been a fixture along one lane of Jack Northrop Avenue on the south side of Hawthorne Municipal Airport.

    Held in place by concrete stands, the tube bears the SpaceX logo. Traffic barriers buffer it from passing vehicles.

    “We are interested in promoting (Hyperloop) as a student venture, not commercial,” SpaceX community outreach manager Lilian Haney said. “We have 1,000-plus students coming for the competitions, and they’re excited about coming to Hawthorne.

    “Pods will be displayed in a street-fair style,” Haney said. “There will be food trucks and presentations. Timing will be flexible because this is the first time it’s ever been done.”

    Races will be interspersed throughout the weekend, with two winners announced late Sunday afternoon. The fastest team will win, along with a second team that judges determine developed the best design.


    All but two of the participating teams are affiliated with universities, including USC, UC Irvine, UC Berkeley and UC Santa Barbara. Other teams hail from such places as Maryland, New York, Colorado, Oklahoma, Virginia, Japan, Spain, Canada, India, and the Netherlands. The nonuniversity teams are a group from a Texas high school and a team of individuals organized from around the world through Reddit.com.

    Finalists were chosen based on their design concepts from a field of 1,200 initial applicants.

    USC’s Hyperloop team underwent a redesign of its pod in September, according to the team’s website.

    “We originally were using air levitation on our pod with a series of air casters providing a cushion of air on which the pod could effectively float,” the team’s blog states. “As a new semester started and new members with fresh insight joined the team, the design changed to one with wheels instead. Our goal is to traverse the test track as fast as possible, as safe as possible, in a semi-autonomous electric vehicle.”

    All of the teams’ work will be open-sourced, per Musk’s directive, to help push the commercial development of such projects.

    “Neither SpaceX nor Elon Musk is affiliated with any Hyperloop companies. While we are not developing a commercial Hyperloop ourselves, we are interested in helping to accelerate development of a functional Hyperloop prototype,” a SpaceX statement reads.

    In his 2013 paper, Musk analyzed the larger issues involved with the Hyperloop concept, such as the impact on the human body of traveling at supersonic speeds and the pros and cons of various propulsion methods.

    “Both for trip comfort and safety, it would be best to travel at high subsonic speeds for a 350-mile journey,” Musk wrote in the paper. “For much longer journeys, such as L.A. to N.Y., it would be worth exploring super high speeds, and this is probably technically feasible, but I believe the economics would probably favor a supersonic plane.”

    Traveling at thousands of miles per hour would be painful for travelers around turns and when speeds change dramatically, the paper states.

    “The key advantages of a tube vs. a railway track are that it can be built above the ground on pylons and it can be built in prefabricated sections that are dropped in place and joined with an orbital seam welder,” wrote Musk.

    Since introducing the idea, several commercial companies have taken up the call. It seems most likely that the world’s first commercial Hyperloop will be built overseas.

    In November, Los Angeles-based Hyperloop One announced the signing of a deal to build a Hyperloop connecting Dubai with the greater United Arab Emirates by 2020.

    “Imagine cutting the time it takes to go from Dubai to Abu Dhabi from 90 minutes to 12 minutes, or Dubai to Riyadh in 48 minutes, or connecting Dubai International Airport and Al Maktoum Airport with a six-minute trip by Hyperloop, forming a single global transport hub,” Hyperloop One said in a company statement.

    The Hyperloop could revolutionize public transpor