Underneath every shiny new megacity, there's often a story of communities displaced. In this moving, poetic talk, OluTimehin Adegbeye details how government land grabs are destroying the lives of thousands who live in the coastal communities of Lagos, Nigeria, to make way for a "new Dubai." She compels us to hold our governments and ourselves accountable for keeping our cities safe for everyone. "The only cities worth building, indeed the only futures worth dreaming of, are those that include all of us, no matter who we are or how we make homes for ourselves," she says.
A blog about Marinwood-Lucas Valley and the Marin Housing Element, politics, economics and social policy. The MOST DANGEROUS BLOG in Marinwood-Lucas Valley.
Saturday, November 9, 2019
Who Belongs in a City
Underneath every shiny new megacity, there's often a story of communities displaced. In this moving, poetic talk, OluTimehin Adegbeye details how government land grabs are destroying the lives of thousands who live in the coastal communities of Lagos, Nigeria, to make way for a "new Dubai." She compels us to hold our governments and ourselves accountable for keeping our cities safe for everyone. "The only cities worth building, indeed the only futures worth dreaming of, are those that include all of us, no matter who we are or how we make homes for ourselves," she says.
Friday, November 8, 2019
THE EXPANDING AND DISPERSING SAN FRANCISCO BAY AREA
THE EXPANDING AND DISPERSING SAN FRANCISCO BAY AREA
by Wendell Cox 11/01/2019

This decade has witnessed an unprecedented expansion of the Greater San Francisco Bay Area (the San Jose-San Francisco combined statistical area or CSA), with the addition of three Central Valley metropolitan areas, Stockton, Modesto and Merced. Over the same period, there has been both a drop in the population growth rate and a shift of growth to the Central Valley exurban metropolitan areas. This expansion was partly justified by the increase in “extreme commutes” – one way work trips of 60 minutes or more.This increased the Bay Area’s already abundant land supply, particularly with the addition of Modesto and Merced. The Central Valley Exurbs added a plain nearly 100 miles north to south and more than 40 miles east to west.
It is notable that the Coast Mountain range did not stop the urban expansion of the Bay Area. Now, nearly 1.6 million Bay Area CSA residents live in the Central Valley exurbs (Figure 1). Much of the growth has to do with the better housing affordability there.
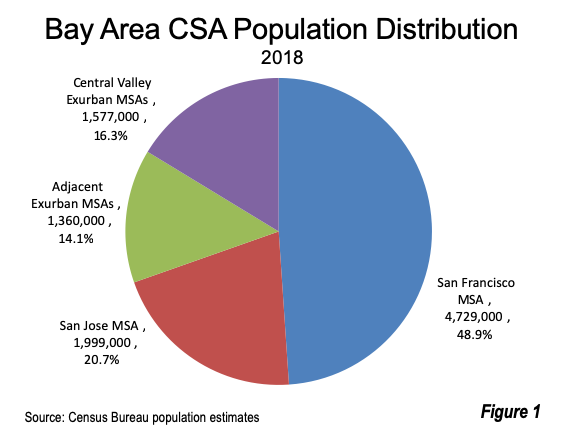
The Bay Area CSA is the broadest definition of the regional labor market, as defined by the White House Office of Management and Budget, using American Community Survey commuting data. It includes the San Francisco metropolitan area (San Francisco, Alameda, San Mateo, Contra Costa, and Marin counties), the San Jose metropolitan area (Santa Clara and San Benito counties), the Santa Rosa metropolitan area (Sonoma County), the Vallejo metropolitan area (Solano County), the Napa metropolitan area (Napa County), the Santa Cruz metropolitan area (Santa Cruz County), the Stockton metropolitan area (San Joaquin County) and the Modesto metropolitan area (Stanislaus) and the Merced metropolitan area (Merced County). The latter shares its southern border with the Fresno CSA.
Population Growth Dropping and Shifting from the Center
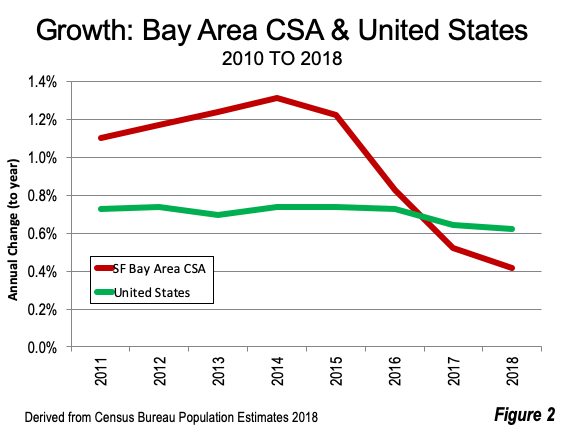
Earlier in the decade (2010 – 2015), propelled by the tech boom, the Bay Area CSA experienced strong growth, adding 1.2% annually to its population. This is more than 50% above the national population growth rate of 0.7% (Figure 2). The last three years, however (2015 – 2018) the population growth rate fell to 0.6%, half that of the 2010 – 2015 rate, well below the national rate. Virtually all of the declining growth rate is attributable to the San Francisco and San Jose metropolitan areas, along with the adjacent exurban metropolitan areas (Santa Rosa, Vallejo, Napa and Santa Cruz).
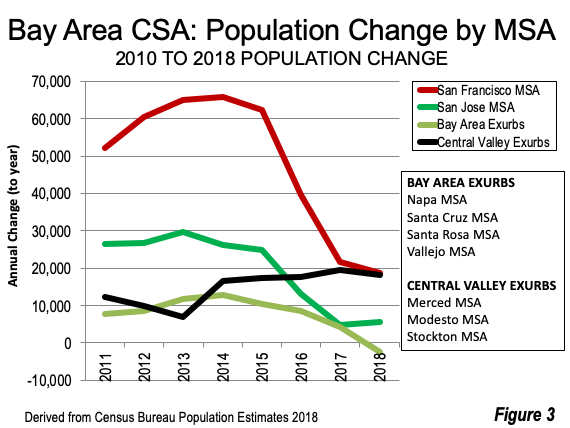
The San Francisco metropolitan area added fewer than 19,000 new residents in 2017 – 2018, a full two thirds below its 60,000 average increase for 2010 – 2015. The San Jose metropolitan area added fewer than 6000 new residents in 2017 – 2018, down approximately 80% from its annual growth of more than 25,000 in 2010 to 2015. The adjacent exurbs, which had added an average of 10,000 residents from 2010 – 2015 saw their growth collapse to a 2000 loss in 2018.This is all the more remarkable in the face of what has been a remarkable economic boom.
Only the Central Valley metropolitan areas sustained their growth, increasing from an annual average of nearly 13,000 in 2010 – 2015 to nearly 18,000 in 2015 – 2018 (Figure 3).
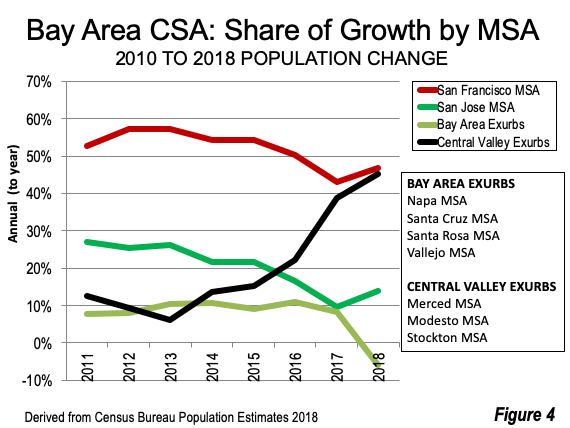
The shift of growth to the Central Valley is illustrated by the tripling of its share of Bay Area CSA growth from 11% in 2010 – 2015 to 35% from 2015 to 2018. The San Francisco metropolitan area fell from 55% of the growth in the first five years to 46% in the last three. The San Jose metropolitan area growth has been nearly halved from 24% to 13%. The adjacent exurbs accounted for 9% of growth in 2010 – 2015, dropping by more than half to 4% between 2015 and 2018 and losing population in 2017 - 2018 (Figure 4).
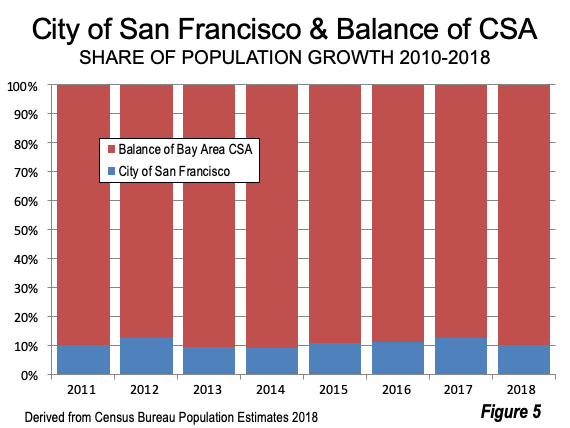
Even so, the city of San Francisco, which accounts for much of the urban core population, has maintained its growth share, having captured 10.6% of the 2010 – 2015 growth and a slightly larger 11.4% in 2015 – 2018 (Figure 5).
Declining Natural Increase Rate
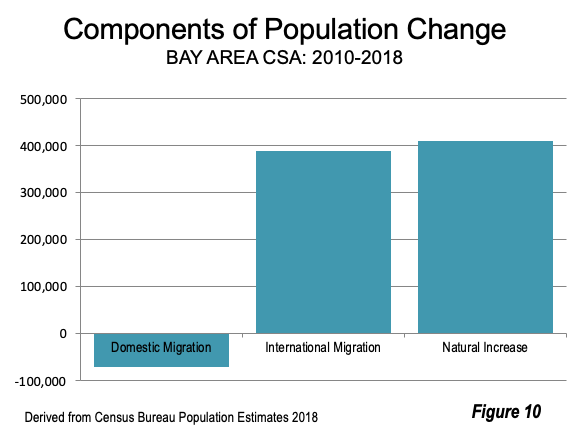
The Bay Area’s annual natural increase in population has been declining. This measure, measured by births minus deaths, dropped from 57,000 in 2010 – 2011 to 42,000 in 2017 – 2018, an overall decline of 26%. The decline was similar in the San Francisco and San Jose metropolitan areas. The largest decline was in the adjacent exurbs, where the natural increase rate declined by more than one half, from 5600 to 2700. The smallest decline was in the Central Valley exurbs, at 17% (Figure 6). The total natural increase was nearly 410,000.
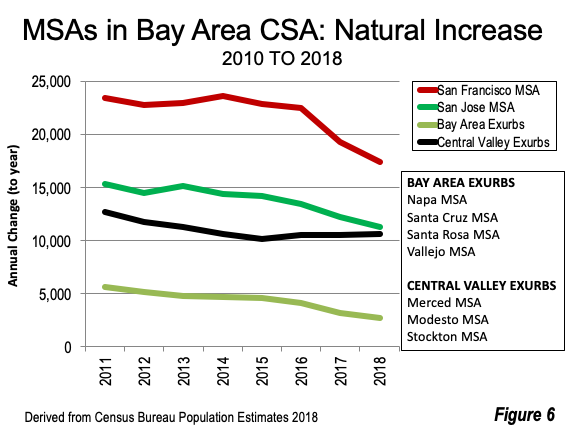
The natural population increase is declining across the nation, due to falling fertility rates. The recent collapse in the Bay Area CSA in domestic outmigration is also a factor. IRS data shows that California’s net domestic outmigration tends to be strongest among households from 26 to 44 years old, ages that produce most of the children. The lowest outmigration rate is among those aged 65 and over.
Meanwhile, Marin County has the oldest median age in the CSA, at 47.2 years. More than nine years older than the national median (38.4). The youngest ages are in the Central Valley exurbs. Merced County has a median age of 32.1, while San Joaquin and Stanislaus counties are at 34.5.
Domestic Migration Collapses
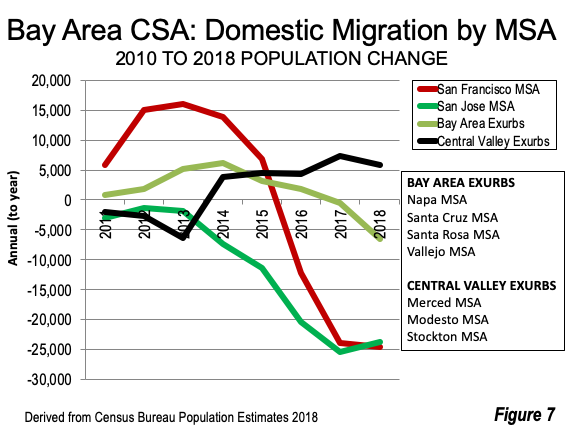
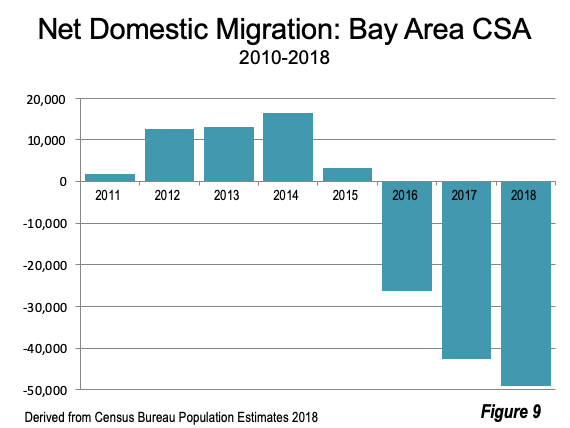
The Bay Area CSA gained an average of 9000 domestic migrants in 2010 – 2015. However, domestic migration collapsed to an annual net loss of 39,000 in 2015 – 2018, reaching a loss of nearly 50,000 in 2017 – 2018 (Figure 7). Net domestic migration dropped strongly in both the San Francisco and San Jose metropolitan areas. The Bay Area CSA net domestic migration loss in 2010 – 2018 was 71,000.
The decline in net domestic migration was less severe in the adjacent exurbs. The Central Valley exurbs experienced positive domestic migration, reversing the early losses that had been precipitated by the devastating effects of the Great Recession (Figure 7).
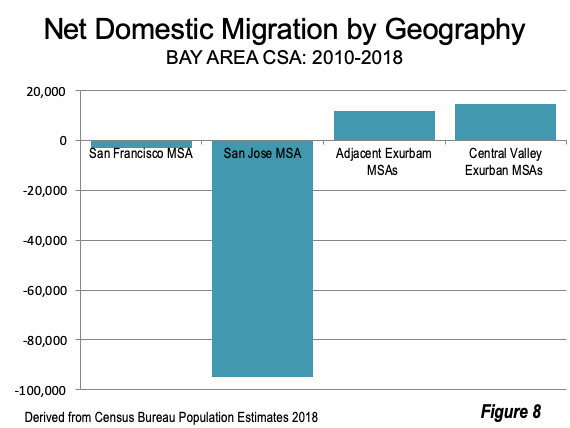
The overall 2000 – 2018 net domestic migration by metropolitan area is shown in Figure 8. The overall decline in Bay Area CSA net domestic migration is illustrated in Figure 9.
International Migration
Net international migration has been more steady, ranging from approximately 40,000 to 60,000 per year, with similar fluctuations throughout the CSA. Net international migration was nearly 390,000 from 2010-2018.
Growth Increasing Only in the Central Valley Exurbs
To summarize, the 2010 – 2008 components of population change in the Bay Area CSA are indicated in Figure 10.
The Bay Area CSA has seen a significant reduction in its pattern of growth as the decade has proceeded. The result is that growth has been largely stunted in the San Francisco, San Jose and adjacent metropolitan areas, with growth increasing only in the Central Valley exurbs. The Bay Area may remain the tech capital of the world, people are moving away, despite the continued economic growth.
Photograph: Central Valley Bay Area Exurbs: From the Stockton metropolitan area, looking south toward the Modesto and Merced metropolitan areas (by author).
Wendell Cox is principal of Demographia, an international public policy and demographics firm. He is a Senior Fellow of the Center for Opportunity Urbanism (US), Senior Fellow for Housing Affordability and Municipal Policy for the Frontier Centre for Public Policy (Canada), and a member of the Board of Advisors of the Center for Demographics and Policy at Chapman University (California). He is co-author of the "Demographia International Housing Affordability Survey" and author of "Demographia World Urban Areas" and "War on the Dream: How Anti-Sprawl Policy Threatens the Quality of Life." He was appointed by Mayor Tom Bradley to three terms on the Los Angeles County Transportation Commission, where he served with the leading city and county leadership as the only non-elected member. Speaker of the House of Representatives appointed him to the Amtrak Reform Council. He served as a visiting professor at the Conservatoire National des Arts et Metiers, a national university in Paris.
Wednesday, November 6, 2019
Monday, November 4, 2019
Sunday, November 3, 2019
FABLE: THE WOLF AND THE LION
THE WOLF AND THE LION
A WOLF had stolen a Lamb and Was carrying it off to his lair to eat it. But his plans were very much changed when he met a lion, who, without making any excuses, took the Lamb away from him.The Wolf made off to a safe distance, and then said in a much injured tone
"You have no right to take my property like that!"
![[Illustration]](http://www.mainlesson.com/books/winter/aesop/zpage045.gif)
The Lion looked back, but as the Wolf was too far away to be taught a lesson without too much inconvenience, he said:
"Your property? Did you buy it, or did the Shepherd make you a gift of it? Pray tell me, how did you get it?"
What is evil won is evil lost.
Subscribe to:
Comments (Atom)