Saturday, July 14, 2018

RWQCB boardmember thanks Marinwood Citizens for persisting for FULL CLEAN UP at Marinwood Plaza

Blue Man Group Tiny Desk Concert

Should Marinwood build a new Community room with shipping containers like this?


shigeru ban: onagawa temporary container housing + community center

Following the earthquake in march 2011, japanese practice shigeru ban architects conceived and implemented ‘onagawa temporary container housing’ along with a community center and atelier within the town of onagawa in the miyagi prefecture of japan. offering families privacy during the recovery, the firm initially embarked upon installing 1800 units of their 2 meter by 2 meter emergency partition system within 50 evacuation facilities. during the process, they learned about the state of the town of onagawa and their difficulties to provide temporary shelter due to the lack of flat land.

To resolve the geographical location’s terrain, a proposal for a three-storey structural framework to allow the stacking of 20 foot shipping containers in a checkerboard fashion. this alternating arrangement allows for airy and open living spaces with built-in shelves and closets for storage, a missing element within the temporary houses issued by the government. since many areas share similar landscape characteristics, these buildings may be constructed in many disaster situations and continue to be used as a long term residential solution due to their excellent seismic performance. three variations are formed by the placement of units, forming a 19.8 square meter unit for 1 to 2 individuals, 29.7 m2 for 3 to 4 inhabitants and 39.6 square meter residences accommodating more than 4 dwellers.

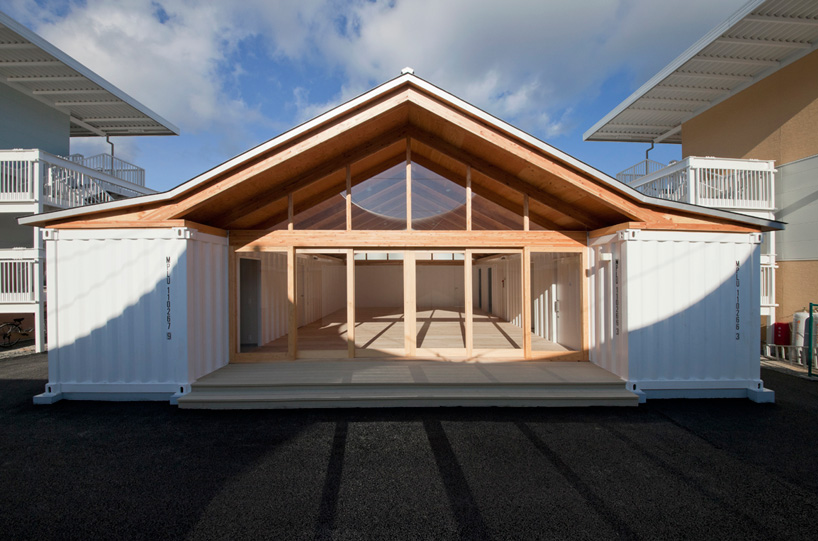
Community center perimeter formed with shipping containers image © hiroyuki hirai

A community center and market are centrally located in the complex, offering a gathering space for community members. the center’s walls are formed with white shipping containers and are capped with a plywood gable roof. triangulated clerestory windows introduce natural daylight into the interior. the area for the food market is formed with a ring of containers and a tentsile roof protects from changing weather.

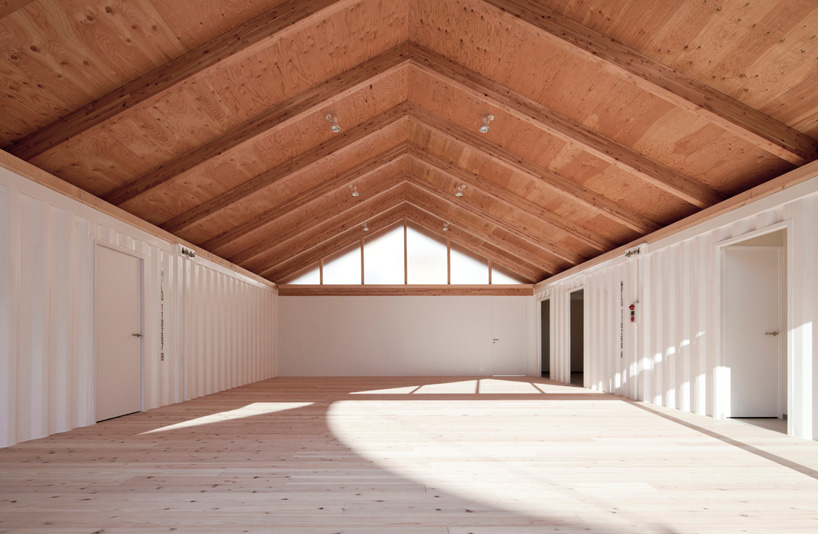
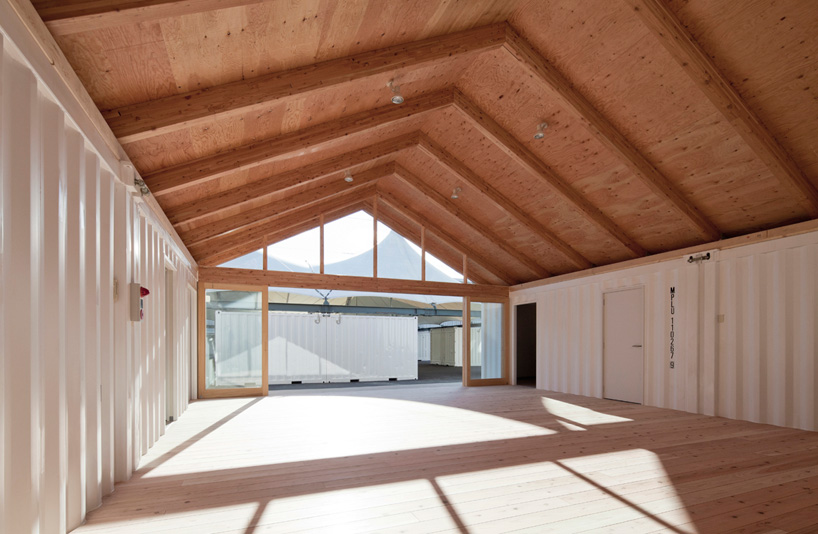
Gable roof of plywood encloses the space image © hiroyuki hirai
Editor's Note. I love the clean, simple design.  This could work for a community room or even the new maintenance shed.

Thursday, July 12, 2018

RWQCB PCE Cleanup hearing for Prosperity Cleaners on 4/11/2017


The California Regional Water Quality Control Board has a hearing to amend the Remediation Action Plan for Prosperity Cleaners in San Rafael, CA 94903. Representatives for Marinwood Plaza, Inc (discharger) the public and affected property owners speak.

Order of Presentation RWQCB - Ralph Lambert presents Staff comments Marinwood Plaza, LLC , Geologica Silveira Ranches Hanson Brigett, St Vincents (Catholic Charities) Clean Up Marinwood Plaza Now Committee, Board Question and Answers. Total time appx 2 hours

Why the poor pay $4,150 for a $1,500 sofa

Rental America: Why the poor pay $4,150 for a $1,500 sofa

No credit, no cash, no bank account? There’s still a place to go shopping, but it comes at a price.

October 16 at 7:56 PM


CULLMAN, Ala. — The love seat and sofa that Jamie Abbott can’t quite afford ended up in her double-wide trailer because of the day earlier this year when she and her family walked into a new store called Buddy’s. Abbott had no access to credit, no bank account and little cash, but here was a place that catered to exactly those kinds of customers. Anything could be hers. The possibilities — and the prices — were dizzying.
At Buddy’s, a used 32-gigabyte, early model iPad costs $1,439.28, paid over 72 weeks. An Acer laptop: $1,943.28, in 72 weekly installments. A Maytag washer and dryer: $1,999 over 100 weeks.
Abbott wanted a love seat-sofa combo, and she knew it might rip her budget. But this, she figured, was the cost of being out of options. “You don’t get something like that just to put more burden on yourself,” Abbott said.
Five years into a national economic recovery that has further strained the poor working class, an entire industry has grown around handing them a lifeline to the material rewards of middle-class life. Retailers in the post-Great Recession years have become even more likely to work with customers who don’t have the money upfront, instead offering a widening spectrum of payment plans that ultimately cost far more and add to the burdens of life on the economy’s fringes.
The poor today can shop online, paying in installments, or walk into traditional retailers such as Kmart that now offer in-store leasing. The most striking change in the world of low-income commerce has been the proliferation of rent-to-own stores such as Buddy’s Home Furnishings, which has been opening a new store every week, largely in the South.
In some ways, the business harkens back to the subprime boom of the early 2000s, when lenders handed out loans to low-income borrowers with little credit history. But while people in those days were charged perhaps an interest rate of 5 to 10 percent, at rental centers the poor find themselves paying effective annual interest rates of more than 100 percent. With business models such as “rent-to-own,” in which transactions are categorized as leases, stores like Buddy’s can avoid state usury laws and other regulations.
And yet low-income Americans increasingly have few other places to turn. “Congratulations, You are Pre-Approved,” Buddy’s says on its Web site, and the message plays to America’s bottom 40 percent. This is a group that makes less money than it did 20 years ago, a group increasingly likely to string together paychecks by holding multiple part-time jobs with variable hours.
It’s a group whose jobs, not so long ago, were more secure and better-paying; they could pay cash at Wal-Mart and had access to more affordable credit. But today, with the excesses of the subprime boom leading conventional banks to stay away from low-income borrowers, it can be their only option. Compared with pre-recession highs, the riskiest borrowers have been all but cut off from access to big loans, like mortgages, experts say.
“Basically, the market pulled back from all low-income borrowers instead of trying to figure out how to serve them,” said Michael Barr, a University of Michigan law professor and author of “No Slack: The Financial Lives of Low-Income Americans.”
Nobody wants to buy items for amounts two or three times what they’d cost at a retail store. But when Abbott did her shopping in February, she didn’t have the money to make even a small lump-sum payment for anything of decent quality, even on Craigslist. She couldn’t buy via a layaway plan; Wal-Mart offers that option only during the holiday season. Perhaps she could have saved up the money on her own, but whenever she has tried to do so, her stash has been wiped out to handle daily needs.
“Rent-to-own was basically all we could do,” Abbott, 33, said.
So Abbott and her husband walked into Buddy’s this past winter, hoping to replace the old sofa in their trailer, six years old, its wiring poking through the bottom, cutting gashes into the living room floor.
Their decision to spring for a new sofa set was, if anything, a bet on the most optimistic arc for their family. Donald was getting regular work, sometimes making $500 in a week, paid by the load to haul pureed chicken guts — used for pet food — to factories across the South. If he could keep up the pace, they’d be okay.
Inside Buddy’s, Abbott walked over to a brown Ashley Furniture model, something she and her husband agreed would fit the colors of their Buccaneer trailer. The love seat had a cup-holder console in the middle and the cushions were plush, and when they took turns testing the feel, they realized it could pivot like a rocking chair.
“I about died when I saw that,” Abbott said months later.
By the next day, the Abbotts had a remade living room, two companion pieces, both of the same blended material, 17 percent leather. The love seat and sofa retailed, together, for about $1,500. Abbott would pay for hers over two years, though she still had paying the option to pay monthly or weekly. The total price if paid weekly: $4,158.

‘I’ve never seen a customer base or an economy like this’

A rent-to-own store provides a front-row seat to observe the bottom of the economy. It is here, at the Buddy’s in Cullman, where customers first gamble that they can handle the payments, even as the new weekly or monthly installments lessen their slack. And it is here where those gambles play out, as customers persist or falter in keeping up with what they owe.
Some persist. The Iraq war veteran who comes in — walking past the camouflage armchairs and bank of flat-screen TVs — with envelopes of cash. The hairdresser who says that if it’s a bad pay week, “I give Buddy’s what I have.” The 37-year-old grandmother who says that pretty much everything in her house comes from this store.
Most falter. At the Buddy’s in Cullman, some 75 percent of items are returned or repossessed within weeks of the transaction, store manager Angela Shutt says. And nationally, the percentage of returns has been gradually ticking upward — a sign of growing struggles for lower-income workers, said Joe Gazzo, the president of Buddy’s.
“I’ve never seen a customer base or an economy like this,” Gazzo said in a telephone interview from the company’s headquarters in Tampa. “You may have five people open an account in a day, but five people return in a day. You almost become like a Blockbuster.”
Buddy’s and its larger competitors, Aaron’s and Rent-A-Center, are criticized by some consumer advocates for predatory strategies. Items are labeled with a buy-at-once “cash price” and an installment price, the weekly payments given the largesttype size. In Cullman, Buddy’s employees pinfliers — “Own it faster for less!” — inside the doors at trailer parks and government housing complexes.
But those in the industry say they offer a legitimate service to an easy-to-overlook customer base. Customers who can’t make the payments face no penalty; because they start out as renters, not owners, they don’t face debts or credit damage if they make a return.
The Cullman store is one of Buddy’s best performers, and the five employees there empathize with their customers. Derek Bland, who drives around the county repossessing items from derelict renters, just left a job at Papa John’s. Brandy Day, one of the saleswomen, winces when talking about the jewelry that Buddy’s keeps near the register. “Take away a 42-inch TV from somebody, that’s one thing,” Day says. “But a wedding ring?”
Buddy’s rapid expansion was rooted in the economic crisis. As recently as 2007, Buddy’s — private, family-run — was essentially a Florida-based company. But as the first mortgages starting going bust, Buddy’s saw 6,000 products returned over several weeks, Gazzo said. The initial goal of expansion, Gazzo said, was less about domination than survival: Buddy’s wanted to get away from Florida, the epicenter of the real estate bubble.
The company found itself with a thriving strategy almost by accident. On a Web site for potential franchise owners, Buddy’s says that many customers who had access to subprime loans before the recession now are “unable to obtain traditional financing and therefore remain within the [rent-to-own] customer base.”
In 2008, Buddy’s had 80 stores. Now it has 204. By 2017 it wants to have 500. Gazzo said that company revenue is rising at double-digit levels annually, even as it contends with a new wave of rent-to-own Web sites.
“The industry as a whole is in the biggest fight we’ve had, because we have to compete with everybody,” Gazzo said. “And the customer doesn’t have as much money as they used to.”

‘I don’t know how we’ll make it’

Abbott has spent eight months now with the sofa set, and some days, she can shrug off the costs. She’ll sink into the cushions just before her kids get out of school and say she wouldn’t trade the feeling “for a million bucks.” Normal families have sofas, she says, and you’ll do what it takes to feel normal.
But other days, like this one, a recent Thursday, the trade-offs felt more intense. It was a payday, and Donald called a toll-free number before sunrise to see how much was left on the family’s prepaid H&R Block debit card.
“Two hundred and thirty dollars,” he heard the automated voice say , and that number represented his latest weekly paycheck — the family’s total balance, and all they’d have for a week. Abbott and Donald smoked a cigarette in the bathroom and sorted through the grim math. It was less than they were used to, but sickness and an oversupply of drivers had left Donald with the shrunken paycheck.
Already, they’d taken out their last $1,500 in savings, putting two-thirds toward a new fuel pump for their sputtering Ford and one-third to Buddy’s for back payments. Some weeks, they couldn’t pay their cellphone bills. They hadn’t eaten out in two months.
They were perpetually behind with their Buddy’s installments and had taken to skipping one week and then catching up, with a $5 late fee rolled in. To make matters worse, those payment trips to Buddy’s put them eye to eye with more temptations. One week, they added a smartphone to their order. Another week, some Samsung speakers. And suddenly, the weekly payments to Buddy’s were $110.
And on weeks such as this, those payments had become unimaginable, especially with the $598.99 monthly mortgage payment on their trailer.
“I don’t know how we’ll make it,” Abbott said, and every solution came with a problem. Return the sofa? Sure, but she’d burn the money she’d already put into it and leave her living room with a hole. Find work? She’s tried, but neither Wal-Mart nor Jack’s nor the nursing home cafeteria have shown interest in an applicant with psoriasis and a ninth-grade education. Hope and wait? Maybe Donald could get more work driving his “gut truck” — say, two cross-state hauls in a day, rather than one — but that was up to his employer.
By midday that Thursday, $51 of the $230 had already vanished, used for gas and cigarettes, and Abbott headed to Wal-Mart looking to spend as little as possible on groceries. She grabbed a 12-pack of ramen, some hot-dog buns and bumped into a friend, Rachel Bryant, in the Halloween aisle.
“You look tired,” Bryant said.
“My sugar levels are out of whack,” Abbott said.
Bryant nodded and then Abbott went quiet, dabbing her eyes.
“I’ve held it in all day long,” she said, choking out the words.
She got out of Wal-Mart having spent just $11.18 and headed back to her car, still with several more hours before she had to pick up her kids, make dinner and think about how to stretch her money for another six days.
“We’ve always talked about the benefits and costs,” she said on the drive home. “Because with a family you can’t just say, ‘I want this, I’m going to get it.’ But growing up having the chair, the recliner, the love seat, the couch and everything, you just get used to the normal stuff. Sometimes it’s hard to break from the normal stuff and get to reality.”


Journalism in a Surveillance State. "How can we have a free press?"

We did all the marketing right but the dogs didn't like the dogfood*" ABAG considers what went wrong with Plan Bay Area I


Brad Paul demonstrates the arrogance and stupidity of the ABAG staff.  They call us names and think we cannot do math.  Gee,  maybe we REJECT the massive urbanization and Government control..   Maybe we don't want central planners guiding every aspect of our lives and destroy our neighborhoods.   He is a hint Mr. Paul.  We love our communities.  We love our homes and we don't need ABAG to "improve our lives".

At 5:00 Mr. Paul uses an illustration of Wincup "stack and pack" as an example of bad construction.  See the written reports of ABAG insights HERE
===========================================================================

*We did the marketing right but the dogs didn't like the dog food" refers to marketing folklore about a major product launch that failed.

"We did everything right. We hired the best agency. Celebrity endorsements.  Bought millions of dollars in prime time advertising. Got prime shelf space in the stores.  It was destined to be a hit!"

What happened?

"The dogs wouldn't eat it"

Product testing with end users is an important step of any successful product launch.  Success takes hold only AFTER the "dogs eat the dog food".


Beer made from recycled wastewater passes taste test

Beer made from recycled wastewater passes taste test


By Peter FimriteOctober 23, 2015 Updated: October 23, 2015 9:00pm


Photo: Nathaniel Y. Downes, The Chronicle


From left, Brandon Cono and Wendell Smith, bartenders at the Annual Meeting of The Minds, an event where the future of urban sustainability is reviewed, work behind the bar in Craneway Pavilion on Thursday, Oct. 22, 2015 in Richmond, Calif.

It was a tough call, but Hugo Von Meijenfeldt thought he detected a hint of astronaut wastewater in the beer that he had just gulped.

The consul general for the Netherlands — who, as representative of the second-largest exporter of beer in the world, purports to know his way around a brewery — declared with some authority that the robust brew he had just tasted was the one made out of recycled wastewater supplied by NASA.

MORE ON RECYCLED WATER
Will the ‘yuck factor’ sink California water recycling?


He was wrong.


“I liked the one that was less hoppy, which I thought was not the recycled beer,” said Von Meijenfeldt, one of two people on a five-judge panel at the Meeting of the Minds sustainability convention taste test in Richmond on Thursday who couldn’t tell one potation from the other.

The blind tasting was an attempt by Maverick’s Brewing Co., an affiliate of Half Moon Bay Brewing Co., to bring attention to the importance of using wastewater as a resource and combat what water officials call the “yuck factor.” The event was held in front of more than 400 leaders from 15 countries during an all-day conference at Richmond’s Craneway Pavilion to discuss various urban sustainability projects.

The prospect of treating sewer water and redirecting it back into faucets is considered by many the future of California. Such recycling, which involves treating what washes down the drain until it is pure, would save hundreds of billions of gallons that is now dumped into the Pacific Ocean annually.

Photo: Nathaniel Y. Downes, The Chronicle


Adam Lenz, a member of the Annual Meeting of The Minds, an event where the future of urban sustainability is reviewed, mingles outside Craneway Pavilion on Ford Point drinking beer made from recycled grey water on Thursday, Oct. 22, 2015 in Richmond, Calif.

“I really wanted to showcase the value of recycling water and get the public’s attention,” said Russ Drinker, an architect and trustee for Sustainable Silicon Valley, who spearheaded the recycled beer project. “Going back to the Phoenicians, beer was the way they created safe water because brewing it requires boiling it.”

Drinker said his work in Singapore and in Saudi Arabia, which recycle virtually all of their wastewater, convinced him of its efficiency and showed him how out of the loop California and the rest of the United States are on the technology. It is currently illegal in California for water districts to send recycled water directly through the tap or for merchants to sell products that use it.

‘Obvious source of water’

“I was surprised and a little angry that California does not recycle its water, especially in the context of this drought,” he said. “To me, it was the most obvious source of water, and once you have it, it is a really valuable asset.”

Drinker recruited Lenny Mendonca, owner of the Half Moon Bay Brewing Co., who liked the idea of the recycled beer tasting. The problem was to find a source of wastewater. Drinker knew someone at NASA, which has long used recycled urine in space, and convinced agency officials to supply Mendonca with gray water — the flow from sinks, showers and washing machines — from one of its facilities.

There was no denying from the judges Thursday that the zesty concoction created from the space agency water warranted serious consideration — it was so good, in fact, that several jokesters in the audience stopped referring to it as “I Pee A Beer” after they tasted it.

“I thought it tasted great. It was delicious,” said beer judge Jennifer Biesty, the chef and owner of Shakewell, a Mediterranean-style restaurant in Oakland.

On a hunch, she correctly picked out the recycled beer because it was less hoppy and bitter than the other IPA she quaffed down. “I actually liked the recycled one better,” she said.

Bay Area testing

Biesty said she would happily serve beer made out of recycled water in her restaurant if it were legal.

Two water districts in the Bay Area — the Dublin San Ramon Services District and the Santa Clara Valley Water District — are testing systems that filter sewer water and purify it to the point that it can be consumed by the public. Orange County has a system in place that recycles 100 million gallons of wastewater a day — enough to quench the thirst of 850,000 people — by treating it and injecting it into aquifers.

Photo: Nathaniel Y. Downes, The Chronicle


From left, Wendell Smith and Brandon Cono, bartenders at the Annual Meeting of The Minds, an event where the future of urban sustainability is reviewed, add beer cans to the display on the bar in Craneway Pavilion on Thursday, Oct. 22, 2015 in Richmond, Calif.

The problem is that California does not allow the public to drink recycled water directly out of a treatment plant, a rule that exists largely because of the yuck factor. Recycled water currently has to be injected into the aquifer and mixed with groundwater before it can be pumped up and used as drinking water. The process of leaching through the ground naturally cleanses water, but water officials say it isn’t needed because of advanced technology.

Legislation has been introduced to make it legal to purify sewer water and send it right back to consumers. The California Water Resources Control Board is expected to issue a report in December on the feasibility of such a system.

“I think it’s an awesome concept,” Biesty said. “It makes sense, especially with the drought and global warming.”

Good enough to sell

Mendonca, who is allowed to use his recycled beer only for free tastings, said that the new brew is good enough to sell and that the water used to make it should be available to the public.

Photo: Nathaniel Y. Downes, The Chronicle


Ken Homer takes his first sip of a recycled grey water beer being sampled at the Annual Meeting of The Minds, an event where the future of urban sustainability is reviewed, in Craneway Pavilion on Ford Point on Thursday, Oct. 22, 2015 in Richmond, Calif.

“If people can drink a beer that tastes good, why not drink the water,” Mendonca said, explaining that all the water on Earth has been recycled from the beginning of time. “This is not something new. It’s back to the future.”

Von Meijenfeldt, whose diplomatic post covers 13 Western states, including California, is expected to keep his job despite confessing to a preference for craft beer over Heineken. He was among a large crowd who stayed after the conference to have another go at the astronaut ale.

“I chose the wrong one for the wrong reasons,” said the Dutchman, as he slurped the heady hooch, “but two times wrong makes for a positive.”


Peter Fimrite is a San Francisco Chronicle staff writer. E-mail: pfimrite@sfchronicle.com Twitter: @pfimrite.

Tuesday, July 10, 2018

Sign this Petition to Clean Up Marinwood Plaza Now.


Marin traffic is mostly local, study finds

Marin traffic is mostly local, study finds

Morning traffic crawls on southbound Highway 101 toward Terra Linda. The average daily trip length in Marin is 8.1 miles, 17 percent longer than the Bay Area average, according to a new study. (Robert Tong/Marin Independent Journal)
Morning traffic crawls on southbound Highway 101 toward Terra Linda. The average daily trip length in Marin is 8.1 miles, 17 percent longer than the Bay Area average, according to a new study. (Robert Tong/Marin Independent Journal) 
The Marin traffic study showed that 72 percent of trips were within the county and 24 percent were to or from the county. Pass-through traffic accounted for the rest. (Alan Dep/Marin Independent Journal)
The Marin traffic study showed that 72 percent of trips were within the county and 24 percent were to or from the county. Pass-through traffic accounted for the rest. (Alan Dep/Marin Independent Journal) 
Much of the traffic in Marin is from residents traveling within the county, according to a study using data collected from mobile devices that will be reviewed by the Transportation Authority of Marin later this month.
The agency commissioned the $30,000 study to get a better understanding of Marin’s travel patterns to help it make policy decisions.
More specifically, the agency wanted to examine the origin and destinations of commuters on Highway 101 at the Marin-Sonoma county line, Highway 37, the Richmond-San Rafael Bridge and the Golden Gate Bridge.
“It helps us understand the traffic patterns in the county,” said Kevin Johnson, of Walnut Creek-based Fehr and Peers, a transportation consultant group that produced the study, which was discussed Monday at TAM’s programming and projects executive committee meeting.
Marin residents might want to look in the mirror to see who causes county traffic woes. The data show that about 72 percent of trips are within Marin. Another 24 percent are trips in or out of the county, while 4 percent are passing through Marin during morning and afternoon peak periods.

See full article in the Marin IJ HERE

Editor's Note:  This report doesn't surprise the local residents who are not pushing housing and transit projects.  Hopefully, the politicians will recognize that "one size doesn't fit all" when it comes to development. This is why Plan Bay Area and regional government is doomed to fail.  Unless we move to 100% command economy like socialism, people will exercise their free choice and will seek to maximize their freedoms.  Simply building the SMART train and declaring it as a "traffic reduction" strategy doesn't make it so.  Building tax payer subsidized housing will never meet the need for affordable housing.  Unfortunately the progressives pushing all this nonsense never achieve their utopia and destroy freedoms instead. Just why are we funding TAM if they are not doing their job of improving transportation? 

What is Middle-Income Housing Affordability?

Charlotte, NC area

What is Middle-Income Housing Affordability?

Few local or metropolitan issues receive more attention than housing affordability. This article provides a perspective on housing affordability. The focus is on the approach used by the Demographia International Housing Affordability Survey, which I co-author annually with Hugh Pavletich (of performanceurbanplanning.org). The Demographia Survey has been published for 14 years. This edition includes housing affordability data and ratings for nearly 300 cities (metropolitan areas) in nine nations (Note 1).

What is Housing Affordability?

Housing affordability is the relationship between housing costs and income. Affordability can only be evaluated if there is a comparison to income. Yet, analysts and journalists often use refer to house prices or rents or their increases without relation to incomes to describe housing affordability. Prices are not an indicator of affordability if they are not compared to incomes but have only anecdotal value. Nor are house price or rent trends an indicator of affordability without comparison to incomes.

What is Middle-Income Housing Affordability?

Middle-income housing affordability is important, because affordable access to quality housing has been pivotal to the democratization of prosperity that occurred in the last century in most high-income nations. Normally, the competitive market has provided middle-income housing without the need for subsidies.
Middle-income is different from low – income housing (also called “affordable housing” or “social housing”), which relies on public subsidies to serve the needs of households unable to afford the house prices or rents prevailing on the open market. Focusing on middle-income does not indicate a lesser interest in low-income housing, because subsidy eligibility requirements are tied to house prices. Better housing affordability translates into fewer households seeking housing subsidies through affordable housing programs (and less public expense).
There are two principal dimensions of middle-income housing affordability — between housing markets and within individual market over time.

Owned and Rented Housing Affordability

Housing affordability can be measured for both owned and rented housing. Price-to-income ratios are typical for owned housing, including the “median multiple” used in the Demographia Survey (below). Percentage of incomes spent on rents are often used to evaluate rental housing affordability.

The Importance of Middle-Income Housing Affordability

Housing is usually the largest budget item for households. The differences in housing costs between major metropolitan areas now increasingly drive differences in the costs of living. Housing costs also vary far more in their high to low range than in the other two major expenditure categories, according to the US Bureau of Economic Analysis, which are services not including rents and goods. (Figure 1).
The differences are even greater when the costs of owned housing are included, as is illustrated by the COU “movers” cost of living index. This index estimates the cost of living for a domestic migrant household moving into the housing market and captures both the differences in rental and owned housing affordability. It is estimated that in the high-cost markets, 85 percent of the higher cost of living stems from higher housing costs (Figure 2).
Middle-income housing affordability is also important to the economy. Paul Cheshire of the London School of Economics and Wouter Vermeulen of VU University wrote, “… [h]ousing being the dominant asset in most households’ portfolios, there are also repercussions on saving, investment and consumption choices.” Where housing is more affordable, households will have more discretionary income to purchase additional goods and services and to save (which generates investment). All of this can contribute to job creation and a stronger economy.
Not only do higher house prices lead to a lower standard of living, but can also increase poverty. For example, California has the highest housing cost adjusted poverty rate among the 50 states of the United States, at 20.4%. This compares to California’s 14.5% rate without adjustment for housing costs.

Owned Housing Affordability Metrics

One of the most utilized owned housing affordability metrics is the price-to-income ratio. A United Nations publication indicated:
“If there is a single indicator that conveys the greatest amount of information on the overall performance of housing markets, it is the house price-to-income ratio. It is obviously a key measure of housing affordability. When housing prices are high relative to incomes, other things being equal, a smaller fraction of the population will be able to purchase housing.”
The Demographia International Housing Affordability Survey uses the median multiple (median house price divided by median household income). The evaluation criteria is in Figure 3.

The Geography of Housing Affordability

Demographia evaluates housing affordability between housing markets: Housing markets are coterminous with labor markets (metropolitan areas). Within housing markets, there will typically be a large urban area, which is defined an expanse of contiguous built-up land (see Demographia World Urban Areas). The area beyond the urban periphery is defined as the urban fringe, which is generally the land between the principal urban area and the boundaries of the metropolitan area. Typically, the urban fringe contains virtually all of the greenfield (undeveloped) land that can be used for new housing. Much of the growth of urban areas that has occurred since World War II in Australia, Canada, New Zealand, and the United States has been in detached housing tracts in greenfield areas.
Thus, for example, the New York housing market includes the entire New York metropolitan area, which stretches from Montauk Point on Long Island (east) to Pike County, Pennsylvania (west) to Ocean County, New Jersey (south) and to Dutchess County (north). The city of New York and other municipalities are only parts of the New York housing market.
Housing affordability may also be evaluated within a housing market. For example, the housing affordability in Brooklyn can be compared to that of White Plains. Or, housing affordability can be compared between more local neighborhoods, like Rainier Valley and Ballard in Seattle. Demographia evaluates housing affordability only at the housing market level and thus does not evaluate housing affordability between areas within housing markets.

The Time Dimension of Housing Affordability

The other important housing affordability comparison is historical, or over time. Thus, housing affordability may be compared for the same or multiple housing markets between 2000 and 2017.

The Need for Clarity

As many cities evaluated by Demographia suffer severe housing affordability, evaluations need to be conducted with sufficient clarity. Serious housing affordability evaluation requires comparison that includes incomes, as well as comparisons between housing markets and over time. In fact, much of the nation remains affordable by historic standards — severe unaffordability is limited to a minority of markets. The public is misled by analyses that fail to include both prices and incomes (See related article: “Housing Affordability from Vancouver to Sydney and Toronto: Time to Do What Works“).
Note 1: Metropolitan areas are “economic cities,” generally not related to the physical jurisdictions of cities as local government authorities, which may be larger or smaller than metropolitan areas.
Note 2: Parts of this article are adapted from published materials I have authored or co-authored.
Wendell Cox is principal of Demographia, an international public policy and demographics firm. He is a Senior Fellow of the Center for Opportunity Urbanism (US), Senior Fellow for Housing Affordability and Municipal Policy for the Frontier Centre for Public Policy (Canada), and a member of the Board of Advisors of the Center for Demographics and Policy at Chapman University (California). He is co-author of the “Demographia International Housing Affordability Survey” and author of “Demographia World Urban Areas” and “War on the Dream: How Anti-Sprawl Policy Threatens the Quality of Life.” He was appointed to three terms on the Los Angeles County Transportation Commission, where he served with the leading city and county leadership as the only non-elected member. He served as a visiting professor at the Conservatoire National des Arts et Metiers, a national university in Paris.

Monday, July 9, 2018

California’s Climate Extremism


California’s Climate Extremism

https://www.city-journal.org/html/californias-climate-extremism-16002.html


Joel KotkinJuly 3, 2018
California
Infrastructure and energy


Environmental extremism increasingly dominates California. The state is making a concerted attack on energy companies in the courts; a bill is pending in the legislature to fine waiters $1,000—or jail them—if they offer people plastic straws; and UCLA issued a report describing pets as a climate threat. The state has taken upon itself the mission of limiting the flatulence of cows and other farm animals. As the self-described capital of the anti-Trump resistance, California presents itself as the herald of a green, more socially and racially just society. That view has been utterly devastated by a new report from Chapman University, in which coauthors David Friedman and Jennifer Hernandez demonstrate that California’s draconian anti-climate-change regime has exacerbated economic, geographic, and racial inequality. And to make things worse, California’s efforts to save the planet have actually done little more than divert greenhouse-gas emissions (GHG) to other states and countries.

Jerry Brown’s return to Sacramento in 2011 brought back to power one of the first American politicians to embrace the “limits of growth.” Brown has long worried about resource depletion (including such debunked notions as “peak oil”), taken a Malthusian approach to population growth, and opposed middle-class suburban development. Like many climate-change activists, he has limitless confidence in the possibility for engineering a green socially just society through “the coercive power of the state,” but little faith that humans can find ways to address the challenge of climate change. If Brown’s “era of limits” message in the 1970s failed to catch on with the state’s voters, who promptly elected two Republican governors in his wake, he has found in climate change a more effective rallying cry, albeit one that often teeters at the edge of hysteria. Few politicians can outdo Brown for alarmism; recently, he predicted that climate change will cause 3 to 4 billion deaths, leading eventually to human extinction. To save the planet, he openly endorses a campaign to brainwash the masses.

The result: relentless ratcheting-up of climate-change policies. In 2016, the state committed to reduce greenhouse-gas (GHG) emissions 40 percent below 1990 levels by 2030. In response, the California Air Resource Board (CARB), tasked with making the rules required to achieve the state’s legislated goals, took the opportunity to set policies for an (unlegislated) target of an 80 percent reduction below 1990 levels by 2050.

Brown and his supporters often tout their policies as in line with the 2015 Paris Agreement, note Friedman and Hernandez, but California’s reductions under the agreement require it to make cutbacks double those pledged by Germany and other stalwart climate-committed countries, many of which have actually increased their emissions in recent years, despite their Paris pledges.

Governor Brown has preened in Paris, at the Vatican, in China, in newspapers, and on national television. But few have considered how his policies have worked out in practice. California is unlikely to achieve even its modest 2020 goals; nor is it cutting emissions faster than other states lacking such dramatic legislative mandates. Since 2007, when the Golden State’s “landmark” global-warming legislation was passed, California has accounted for barely 5 percent of the nation’s GHG reductions. The combined total reductions achieved over the past decade by Ohio, Georgia, Pennsylvania, and Indiana are about 5 times greater than California’s. Even Texas, that bogeyman of fossil-fuel excess, has been reducing its per-capita emissions more rapidly.

In fact, virtually nothing that California does will have an impact on global climate. California per-capita emissions have always been relatively low, due to the mild climate along the coast, which reduces the need for much energy consumption on heating and cooling. In 2010, the state accounted for less than 1 percent of global GHG emissions; the disproportionately large reductions sought by state activists and bureaucrats would have no discernible effect on global emissions under the Paris Agreement. “If California ceased to exist in 2030,” Friedman and Hernandez note, “global GHG emissions would be still be 99.54 percent of the Paris Agreement total.”

Many of California’s “green” policies may make matters worse. California, for example, does not encourage biomass energy use, though the state’s vast forested areas—some 33 million acres— could provide renewable energy and reduce the excessive emissions from wildfires caused by years of forest mismanagement. Similarly, California greens have been adamant in shutting down nuclear power plants, which continue to reduce emissions in France, and they refuse to count hydro-electricity as renewable energy. As a result, California now imports roughly one-third of its electricity from other states, the highest percentage of any state, up from 25 percent in 2010. This is part of what Hernandez and Friedman show to be California’s increasing propensity to export energy production and GHG emissions, while maintaining the fiction that the state has reduced its total carbon output.

Overall, California tends to send its “dirty work”—whether for making goods or in the form of fossil fuels—elsewhere. Unwanted middle- and working-class people, driven out by the high cost of California’s green policies, leave, taking their carbon footprints to other places, many of which have much higher per-capita emission rates. Net migration to other, less temperate states and countries has been large enough to offset the annual emissions cuts within the state. Similarly, the state’s regulatory policies make it difficult for industrial firms to expand or even to remain in California. Green-signaling firms like Apple produce most of their tangible products abroad, mainly in high-GHG emitting China, while other companies, like Facebook and Google, tend to place energy-intensive data centers in other, higher GHG emission states. The study estimates that GHG emissions just from California’s international imports in 2015, and not even counting imports from the rest of the U.S., amounted to about 35 percent of the state’s total emissions.

California’s green regulators predict that the implementation of ever-stricter rules related to climate will have a “small” impact on the economy. They point to strong economic and job growth in recent years as evidence that strict regulations are no barrier to prosperity. Though the state’s economic growth is slowing, and now approaches the national average, a superficial look at aggregate performance makes a seemingly plausible case for even the most draconian legislation. California, as the headquarters for three of the nation’s five largest companies by market capitalization—Alphabet, Apple, and Facebook— has enjoyed healthy GDP growth since 2010. But in past recoveries, the state’s job and income growth was widely distributed by region and economic class; since 2007, growth has been uniquely concentrated in one region—the San Francisco Bay Area, where employment has grown by nearly 17 percent, almost three times that of the rest of the state, with growth rates tumbling compared with past decades.

Some of these inequities are tied directly to policies associated with climate change. High electricity prices, and the war on carbon emissions generally, have undermined the state’s blue-collar sectors, traditionally concentrated in Los Angeles and the interior counties. These sectors have all lost jobs since 2007. Manufacturing employment, highly sensitive to energy-related and other regulations, has declined by 160,000 jobs since 2007. California has benefited far less from the national industrial resurgence, particularly this past year. Manufacturing jobs—along with those in construction and logistics, also hurt by high energy prices—have long been key to upward mobility for non-college-educated Californians.

As climate-change policies have become more stringent, California has witnessed an unprecedented level of bifurcation between a growing cadre of high-income earners and a vast, rapidly expanding poor population. Meantime, the state’s percentage of middle-income earners— people making between $75,000 and $125,000—has fallen well below the national average. This decline of the middle class even occurs in the Bay Area, notes a recent report from the California Budget and Policy Center, where in 1989 the middle class accounted for 56 percent of all households in Silicon Valley, but by 2013, only 45.7 percent. Lower-income residents accounted for 30.3 percent of Silicon Valley’s households in 1989, and that number grew to 34.8 percent in 2013.

Perhaps the most egregious impact on middle and working-class residents can be seen in housing, where environmental regulations, often tied directly to climate policies, have discouraged construction, particularly in the suburbs and exurbs. The state’s determination to undo the primarily suburban, single-family development model in order to “save the planet” has succeeded both in raising prices well beyond national norms and creating a shortfall of some 3 million homes.

As shown in a recent UC Berkeley study, even if fully realized, the state’s proposals to force denser housing would only reach about 1 percent of its 2030 emissions goals. Brown and his acolytes ignore the often-unpredictable consequences of their actions, insisting that density will reduce carbon emissions while improving affordability and boosting transit use. Yet, as Los Angeles has densified under its last two mayors, transit ridership has continued to drop, in part, notes a another UC Berkeley report, because incentives for real-estate speculation have driven the area’s predominantly poor transit riders further from trains and buses, forcing many to purchase cars.

Undaunted, California plans to impose even stricter regulations, including the mandatory installation of solar panels on new houses, which could raise pricesby roughly $20,000 per home. This is only the latest in a series of actions that undermines the aspirations of people who still seek “the California dream;” since 2007, California homeownership rates have dropped far more than the national average. By 2016, the overall homeownership rate in the state was just under 54 percent, compared with 64 percent in the rest of the country.

The groups most affected by these policies, ironically, are those on whom the ruling progressives rely for electoral majorities. Millennials have seen a more rapid decline in homeownership rates compared with their cohort elsewhere. But the biggest declines have been among historically disadvantaged minorities—Latinos and African-Americans. Latino homeownership rates in California are well below the national average. In 2016, only 31 percent of African-Americans in the Bay Area owned homes, well below the already low rate of 41 percent black homeownership in the rest of nation. Worse yet, the state takes no accountof the impact of these policies on poorer Californians. Overall poverty rates in California declined in the decade before 2007, but the state’s poverty numbers have risen during the current boom. Today, 8 million Californians live in poverty, including 2 million children, by far the most of any state. The state’s largest city, Los Angeles, is also now by some measurements America’s poorest big city.

To allay concerns about housing affordability, the state has allocated about $300 million from its cap-and-trade funds for housing, a meager amount given that the cost of building affordable housing in urban areas can exceed $700,000 per unit. These benefits are dwarfed by those that wealthy Californians enjoy for the purchase of electric cars and home solar: Tesla car buyers with average incomes of $320,000 per year got more than $300 million in federal and state subsidies by early 2015 alone. By contrast, in early 2018, state electricity prices were 58 percent higher, and gasoline over 90 cents per gallon higher, than the national average, disproportionately hurting ethnic minorities, the working class, and the poor. Based on cost-of-living estimation tools from the Census Bureau, 28 percent of African-Americans in the state live in poverty, compared with 22 percent nationally. Fully one-third of Latinos, now the state’s largest ethnic group, live in poverty, compared with 21 percent outside the state.

In a normal political environment, such disparities would spark debate, not only among conservatives, but also traditional Democrats. Some, like failed independent candidate and longtime environmentalist Michael Shellenberger, have expressed the view that California’s policies have made it not “the most progressive state” but “the most racist one.” Recently, some 200 veteran civil rights leaders sued CARB, on the basis that state policies are skewed against the poor and minorities. So far, their voices have been largely ignored. The state’s prospective next governor, Gavin Newsom, seems eager to embrace and expand Brown’s policies, and few in the legislature seem likely to challenge them. The Republicans, for now, look incapable of mounting a challenge.

This leaves California on a perilous path toward greater class and racial divides, increasing poverty, and ever-more strenuous regulation. Other ways to reduce greenhouse gases—such as planting trees, more efficient transportation, and making suburbs more sustainable—should be on the table. The Hernandez-Friedman report could be a first step toward addressing these issues, but however it happens, a return to rationality is needed in the Golden State.

Joel Kotkin serves as Presidential Fellow in Urban Futures at Chapman University and executive director of the Center for Opportunity Urbanism