
Warning Marinwood!
Marin’s Estimated Housing Quotas Are Off The Chart!
Posted by: Sharon Rushton - October 14, 2020 - 4:13pm
A series of erroneous state and regional policy and planning decisions, some of which were pushed by Big Real Estate and Big Tech, have culminated in the Association of Bay Area Governments (ABAG) being on the brink of assigning unprecedented, exorbitant, unrealistic and flawed housing quotas to Marin County and its 11 municipalities. These housing quotas, known as Regional Housing Need Allocations (RHNA), are off the chart!
The Regional Housing Need Allocation (RHNA) is the state-mandated process to identify the total number of housing units each jurisdiction must accommodate. As part of this process, the California Department of Housing and Community Development (HCD) calculates the total housing need (referred to as the Regional Housing Needs Assessment) for each planning region, including the San Francisco Bay Area, for an eight-year period. Then, each region’s planning agency, including the Association of Bay Area Governments (ABAG), distributes this need to local governments.
On October 15th, the Association of Bay Area Government Executive Board will decide whether or not to adopt “Option 8A” as the allocation methodology to determine the Regional Housing Need Allocations (RHNA) (AKA Housing Quotas) for jurisdictions throughout the Bay Area.
If the Board adopts this allocation methodology (Option 8A), then the Estimated Marin County RHNA (2024-2032) would be 14,210 housing units. This is more than the current number of homes in Sausalito and Mill Valley combined! Due to new laws, this means that Marin County jurisdictions would need to not only identify sites (and adjust zoning on those sites) for over 14,000 homes but, in addition, ensure that new housing is actually constructed on the sites, all within the 8-year RHNA cycle. An absolutely impossible task!
Marin's total estimated housing allocation of over 14k units for the 2024-2032 RHNA cycle is over 6 times as large as that for the last 2015-2023 cycle, which was 2,298 units. For some individual jurisdictions, it's even worse. Unincorporated Marin’s new housing quota of 3,830 units is 20 times larger than that for the last RHNA cycle, which was 185 units.
Please review the below charts. The first chart (CHART 1) shows the final Marin County Regional Housing Needs Allocations for the 2015 to 2023 planning period. The second chart (CHART 2) demonstrates a rough estimate of the Marin County Regional Housing Need Allocations for 2024 to 2032, if the Option 8A Allocation Methodology is adopted and if the HCD RHNA Allocation Approach, the Plan Bay Area 2050 Regional Growth Forecast and the “High Opportunity Areas Map” methodology are maintained.
CHART 1: Marin County Regional Housing Need Allocation, 2015-2023

CHART 2: Rough Estimate of Marin County Regional Housing Needs Allocations, 2024-2032

TOTAL 14,210
These estimated housing quotas are completely devoid of credibility, based on Marin’s historic population growth and respected forecasts of Marin’s future population and job growth.
Marin County’s Historic Population Growth Rate:
Marin’s population growth rate has been negative for the last five years. From 2016 through 2020, the growth rate has ranged from -.02% to -.35%. Please see the below chart [1]:

Forecast of Marin County’s Population Growth by the California Department of Finance:
The California Department of Finance forecasts are highly respected and used by most public agencies. The Department of Finance estimates that Marin County’s current population (YR 2020) is 260,800 residents and projects that at the beginning of the next RHNA cycle (YR 2024) our population will be 259,362 residents. Therefore, the Department predicts that Marin’s population will shrink by 1,438 residents by 2024.
Furthermore, the Department of Finance projects that, between 2024 to 2032 (the next 8-year RHNA cycle), Marin County’s population will grow from 259,362 people (YR 2024) to 259,591 people (YR 2032), which is an increase of only 241 more people. [2] [3]
A growth of 241 people doesn’t even replace the 1,438 residents lost between YR 2020 and YR 2024. Hence, at the end of the next RHNA cycle (YR 2032), we will have fewer residents than we do now. This does not translate into a need for a tremendous amount of new housing.
Marin County Job Growth: Per the 2019 Marin County Economic Forecast by the California Department of Transportation; “Job growth in Marin County is slowing and will slow further during the forecast period. Marin County is at risk of losing jobs by 2020 or 2021.”[4]

The above historic population growth rates and the population and job growth forecasts by the Department of Finance and the Department of Transportation demonstrate that the estimated 2024-2032 Marin County housing quotas are far from realistic.
Not only is the Option 8A RHNA Allocation Methodology untenable because of the sheer magnitude of the resulting housing quotas, but, in addition, the methodology is unsound because of where it targets housing growth. Most of the targeted areas in Marin are distant from employment and high-quality public transit, which if developed, would lead to new residents using vehicles for their transportation needs, thereby increasing Green House Gas emissions. Tackling climate change is overlooked.
In addition, many (or most) of the targeted locations are hazardous. These include areas subject to high fire hazards, unsafe evacuation routes, toxic contaminants, sea level rise, flooding, high seismic activity, and high traffic congestion. When trying to improve housing equity, it is unconscionable to expose vulnerable senior and lower income households to high hazard risks, when they have the least resources available to cope with the adversity caused by such hazards.
Perhaps the most important point of all is Marin County’s potential growth is greatly constrained by our limited water supply.
The 2007 Marin Countywide Plan’s Environmental Impact Report (EIR) examined the cities’ and county’s zoning designations and projected potential growth of 14,043 more housing units. This didn’t include density bonuses. Alarmingly, the EIR concluded that “land uses and development consistent with the plan would result in 42 significant unavoidable adverse impacts”, including worse traffic congestion and insufficient water supplies.
The total estimated RHNA (2024 to 2032) for all of Marin is 14,210 housing units. This is similar to the number of housing units (14,043 units) evaluated by the 2007 Marin Countywide Plan’s EIR. Marin’s water supply is insufficient for this magnitude of growth.
In summary, Marin County lacks developable land, has very poor public transit, is encumbered with many environmental hazards and constraints, including a very limited water supply, and has a rapidly growing senior population who will soon retire and contribute to lower employment levels. These factors stunt population, business, and household growth. Respected forecasts confirm that Marin’s population and job growth, and therefore the need for housing growth, will remain flat or decline.
ABAG's RHNA Allocation Methodology and subsequently Marin’s RHNA allocations should be altered to reflect these important factors.
WHAT CAUSED THE HOUSING QUOTA DEBACLE?
A series of erroneous state and regional policy and planning decisions, some of which were pushed by Big Real Estate and Big Tech, have culminated in unrealistic estimated housing allocations for Marin and other jurisdictions throughout the Bay Area.
The Stakeholders
To begin this discussion of “What Went Wrong?”, it’s worth looking at the Stakeholders who are members of the ABAG Housing Methodology Committee. This is the committee that oversaw the creation of the Option 8A RHNA Allocation Methodology and recommended it to the rest of ABAG.
The ABAG Housing Methodology Committee consists of 9 Elected Officials, 12 Staff, 1 Representative from the CA Dept. of Housing & Community Development (HCD), and 16 Stakeholders. The Stakeholders make up 42% of the committee. 14 of the Stakeholders (37% of the methodology committee) are affiliated with housing developers, the building industry, housing advocacy organizations, or transit-oriented-development advocacy groups. The other two Stakeholders are an environmental attorney, who is also an Associate Director at the San Francisco State University, and an executive at La Clinica de la Raza, which is a community health center. There isn’t a single Stakeholder from an environmental or sustainable-slow-growth organization.
Here is a link to the “Housing Methodology Committee Member Bios”:
https://abag.ca.gov/sites/default/files/hmc_member_bios_01_2020.pdf
Flawed Forecasts & Maps
Besides other factors, the ABAG RHNA Allocation Methodology Option 8A incorporates: the Bay Area Regional Housing Need Assessment, which mandates 441,000 more units in the Bay Area by Year 2032; the Plan Bay Area 2050 Blueprint Regional Growth Forecast, which projects an increase of 1.4 million housing units by Year 2050; and the High Opportunity Areas Map, all of which are flawed.
Bay Area Regional Housing Need Assessment (RHNA) Is Exorbitant & Flawed
The California Department of Housing and Community Development assigned the Bay Area region an exorbitant housing need of 441,000 housing units.
As part of the RHNA process, the California Department of Housing and Community Development (HCD) calculates the total housing need (referred to as the Regional Housing Needs Assessment) for each planning region, including the San Francisco Bay Area, for an eight-year period. Then, each region’s planning agency, including the Association of Bay Area Governments (ABAG), distributes this need to local governments. If HCD’s methodology for calculating the total California Regional Housing Needs Assessment is flawed, then all subsequent housing needs for regions and local governments are similarly flawed. The Embarcadero Institute’s report proves that the HCD methodology is indeed defective.
The Embarcadero Institute’s report entitled; “Double Counting in the Latest Housing Needs Assessment” found that; “Senate Bill 828, co-sponsored by the Bay Area Council and Silicon Valley Leadership Group, and authored by Senator Scott Wiener in 2018, has inadvertently doubled the Regional Housing Needs Assessment in California.”
“Use of an incorrect vacancy rate and double counting, inspired by SB-828, caused the state’s Department of Housing and Community Development (HCD) to exaggerate by more than 900,000 the units needed in SoCal, the Bay Area, and the Sacramento area.” [5]
It is important to note that Senate Bill 828 was authored by Senator Scott Wiener, who is heavily financed by Big Tech, Big Real Estate, and California Yimby.[6]
The Plan Bay Area 2050 Regional Growth Forecast Is Unrealistic
By law, the Regional Housing Need Allocation (RHNA) must be consistent with Plan Bay Area 2050. Yet, Plan Bay Area 2050’s Regional Growth Forecast is unrealistic.
The following Table 2 illustrates the approved Regional Growth Forecast for Plan Bay Area 2050 (supposedly integrating impacts from the COVIC-19 Pandemic & the 2020 Recession). Between 2015 and 2050, the region’s employment is projected to grow by 1.4 million to just over 5.4 million total jobs. Population is forecasted to grow by 2.7 million people to 10.3 million. This population will comprise over 4.0 million households, for an increase in nearly 1.3 million households from 2015.[7]

The following historic population growth rates, population growth projections, and historic housing production demonstrate that the Regional Growth Forecast for Plan Bay Area 2050 is misguided.
The California Department of Finance Bay Area Population Forecast:
The California Department of Finance projects that the Bay Area Region will consist of 9,112,910 people in YEAR 2050. [8] [9] This is 1,217,090 less people than the above Plan Bay Area 2050 projection.

California’s Historic Population Growth Rate:
California’s population growth rate is at a record low and predicted to remain low. Estimates released on Dec. 20, 2019 by the California Department of Finance show that between July 1, 2018 and July 1, 2019, the growth rate was just .35%, the lowest recorded growth rate since 1900. During the same time period, the Department reported that there was substantial negative domestic net migration, which resulted in a loss of 39,500 residents – “the first time since the 2010 census that California has had more people leaving the state than moving in from abroad or other states”.[10] Since 2019, we have entered into the COVID-19 recession, which should further lower California’s growth rate.
Historic Versus Projected Housing Production:
Figure 6 (below) illustrates historic housing production and Plan Bay Area 2050’s projected housing production, based on the plan’s anticipated demand for housing units. The plan projects an increase of 1.4 million housing units through 2050. The extreme difference between historic and projected production implies that the plan’s anticipated housing demand is over-exaggerated.

The above historic population growth, forecasted future population growth, and historic housing production demonstrate that the Plan Bay Area 2050 Regional Growth Forecast is unrealistic.
The “High Opportunity Areas Map” is Flawed
The Option 8A Allocation Methodology targets 70% of RHNAs for Very Low and Low households and 40% of RHNAs for Moderate and Above Moderate Units in “High Opportunity Areas”.

Here is the link to the map of "High Opportunity Areas" across California. You can zoom into Marin:
https://belonging.berkeley.edu/tcac-opportunity-map-2020
Below is a map of the “High Opportunity Areas” in Marin County.
Marin County High Opportunity Areas Map

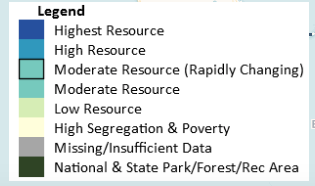
However, the methodology for determining the “High Opportunity Areas Map” is flawed. Moreover, it appears that the Task Force, which created and oversees the Map, does not have accurate information about local characteristics. As a result, areas, which the methodology is supposed to exclude from development, are still being targeted with growth.
In February 2017, The California Fair Housing Task Force (Task Force) was created by the CA Department of Housing and Community Development (HCD) and the California Tax Credit Allocation Committee. HCD and TCAC charged the Task Force with creating an opportunity map to further fair housing and “identify areas in every region of the state whose characteristics have been shown by research to support positive economic, educational, and health outcomes for low-income families - particularly long-term outcomes for children.”[11]
"High Opportunity Areas" are supposed to be areas with high quality public schools, proximity to well-paying jobs, a high-income population, and a clean and safe environment.
However, the Task Force’s methodology for creating the High Opportunity Areas Map fails to fulfill the requirement that the areas be healthy, clean and safe.
The report entitled; “California Fair Housing Task Force Methodology for the 2020 TCAC/HCD Opportunity Map – June 2020” [12] states that the map of “High Opportunity Areas” takes into account the following indicators, measures, and data sources:
Poverty (Percent of population with income above 200% of federal poverty line);
Adult Education (Percent of adults with a BA or above);
Employment (Percent of adults aged 20 to 64 who are employed in the civilian labor force or in the armed forces);Job Proximity (Proximity to low wage jobs filled by workers with less than a BA);
Median Home Value (Value of owner-occupied units);
Pollution Indicators “CalEnviroScreen 3.0 Indicators” (Exposure to traffic density and toxic contaminants in ground, air or water);
Math Proficiency (Percentage of 4th graders who meet or exceed math proficiency standards);
Reading Proficiency (Percentage of 4th graders who meet or exceed literacy standards);
High School Graduation Rates (Percentage of high school cohort that graduated on time);
Student Poverty Rate (Percent of students not receiving free or reduced-price lunch);
Poverty (Tracts with at least 30% of the population falling under the federal poverty line);
Racial Segregation (Tracts with a racial Location Quotient of higher than 1.25 for minorities).
According to the above list of data sources, the only public health and safety concerns that the methodology takes into account are traffic density and toxic contaminants in ground, air, or water. The methodology fails to consider the perils of areas subject to high fire hazards, unsafe evacuation routes, sea level rise, flooding, and high seismic activity,
It is worth repeating… When trying to improve housing equity and further fair housing, it is unconscionable to expose vulnerable senior and lower income households to high hazard risks, when they have the least resources available to cope with the adversity caused by such hazards.
Moreover, if you look at the “High Opportunity Areas Map” for Marin County, you will see that many of the locations with high traffic density and unsafe toxic contaminants are designated “High Opportunity Areas”, even though the methodology supposedly excludes such unsafe areas from growth. Therefore, it is assumed that the Map creators don’t have accurate information about Marin.
Other Problems with the Option 8A RHNA Allocation Methodology
By law, The Regional Housing Needs Allocations (RHNA allocations) must meet the five statutory objectives of RHNA[13] and be consistent with the forecasted development pattern of Plan Bay Area 2050. Yet, the Option 8A RHNA Allocation Methodology fails to fulfill the following RHNA statutory objectives and Plan Bay Area 2050 Draft Blueprint purpose, guiding principle, objectives, strategies, and policy:
The Second Statutory Objective for RHNA is; “Promoting infill development and socioeconomic equity, the protection of environmental and agricultural resources, the encouragement of efficient development patterns, and the achievement of the region’s greenhouse gas reductions targets provided by the State Air Resources Board pursuant to Section 65080.”[14]
The Sixth Statutory Objective for RHNA, pending state legislation, is; “Reducing development pressure within very high fire risk areas.”[15]
As mandated by Senate Bill 375, the main purpose of the Plan Bay Area 2050 Draft Blueprint, the Bay Area’s Sustainable Communities Strategy, is to lower Green House Gas (GHG) emissions from cars and light trucks while accommodating all needed housing growth within the region.
The Plan Bay Area 2050’s Guiding Principle entitled “Healthy” states; “The region’s natural resources, open space, clean water, and clean air are conserved – the region actively reduces it’s environmental footprint and protects residents from environmental impacts.”[16]
Plan Bay Area 2050 Strategy #8 states; “Reduce Risks from Hazards. Adapt the vast majority of the Bay Area’s shoreline to sea level to protect existing communities and infrastructure, while providing means-based financial support to retrofit aging homes.”[17] Until communities and infrastructure are actually protected from sea level rise, areas subject to sea level rise should not be further developed.
Plan Bay Area 2050 Strategy #9 states; “Reduce Environmental Impacts. Maintain the region’s existing urban growth boundaries through 2050, while simultaneously partnering with public and non-profit entities to protect high-value conservation lands. Further expand the Climate Initiatives Program to drive down greenhouse gas emissions.”[18]
The Plan Bay Area 2050 – Draft Blueprint states that Areas Outside Urban Growth Boundaries (including Priority Conservation Areas – PCAs) and Unmitigated High Hazard Areas should be protected.[19] As such, growth should not be targeted in such areas.
Contrary to the above RHNA and Plan Bay Area 2050 objectives, the Option 8A RHNA Allocation Methodology will not further Green House Gas reduction goals or protect residents from hazardous environmental impacts. Option 8A allocates too many housing units to suburban areas that are far from job centers, lack adequate public transit, and are subject to perilous hazards. Especially worrisome is the fact that the methodology increases development in high fire hazard zones with unsafe evacuation routes, and in areas subject to lack of water supply, sea level rise, and flooding.
------
The State’s (HCD's) and the Bay Area regional agencies’ (ABAG’s & MTC’s) approaches to determining the housing need must be defensible and reproducible for cities and counties to be held accountable. Unfortunately, the State and the Bay Area regional agencies are falling far short in this regard.
During the last Regional Housing Needs Allocation (RHNA) cycle (2015-2023), over 400 of California’s 480 municipalities have not reached their RHNA targets. New laws require local jurisdictions to not only identify RHNA sites but, in addition, to ensure that new housing is actually constructed on the sites. Yet, local governments are not developers and cannot force private property owners to build housing units. Indeed, the Embarcadero Institute found that the shortage of housing resulted not from a failure by cities to issue housing permits, but rather a failure by the state to fund and support affordable housing.
Moreover, non-performance in a RHNA income category triggers a streamlined approval process per Senate Bill 35 (2017), which lessens local communities’ control over land use, environmental protections, and quality development.
By issuing such inflated 2024-2032 allocations without providing funds for affordable housing, the State and Regional Agencies are setting local governments up to fail again.
[1] https://worldpopulationreview.com/us-counties/ca/marin-county-population
[2] http://www.dof.ca.gov/Forecasting/Demographics/projections/documents/P1_County_1yr.xlsx
[3] http://www.dof.ca.gov/Forecasting/Demographics/Projections/
[4] https://dot.ca.gov/-/media/dot-media/programs/transportation-planning/documents/socioeconomic-forecasts/2019-pdf/marinfinal-a11y.pdf
[5] https://secureservercdn.net/198.71.233.65/r3g.8a0.myftpupload.com/wp-content/uploads/2020/09/Double-counting-in-the-Latest-Housing-Needs-Assessment-Sept-Update.pdf
[6] https://www.housinghumanright.org/inside-game-california-yimby-scott-wiener-and-big-tech-troubling-housing-push/
[7] https://www.planbayarea.org/sites/default/files/pdfs_referenced/Plan_Bay_Area_2050_-_Regional_Growth_Forecast_July_2020v2DV_0.pdf
[8] http://www.dof.ca.gov/Forecasting/Demographics/projections/documents/P1_County_1yr.xlsx
[9] http://www.dof.ca.gov/Forecasting/Demographics/Projections/
[10] https://www.latimes.com/california/story/2019-12-21/california-population-continues-to-decline-with-state-emigration-a-major-factor
[11] https://www.treasurer.ca.gov/ctcac/opportunity/2020-tcac-hcd-methodology.pdf
[12] https://www.treasurer.ca.gov/ctcac/opportunity/2020-tcac-hcd-methodology.pdf
[13] https://rhna-factors.mtcanalytics.org/data/RHNA_Statutory_Objectives.pdf
[14] https://rhna-factors.mtcanalytics.org/data/RHNA_Statutory_Objectives.pdf
[15] https://rhna-factors.mtcanalytics.org/data/RHNA_Statutory_Objectives.pdf
[16] https://www.planbayarea.org/sites/default/files/PBA2050_GP_Res.4393_Table.pdf
[17] https://www.planbayarea.org/sites/default/files/5b_PBA50_DraftBlueprint_StrategiesAction.pdf
[18] https://www.planbayarea.org/sites/default/files/5b_PBA50_DraftBlueprint_StrategiesAction.pdf
[19] Mayor Pro Tem Pat Eklund. “Report on ABAG to MCCMC”. September, 2020