Saturday, June 27, 2015

Largesse for Losers

Largesse for Losers 
Translating the Left’s rhetoric, and other random thoughts. 
Text   

How long do politicians have to keep on promising heaven and delivering hell before people catch on and stop getting swept away by rhetoric?

Why should being in a professional sport exempt anyone from prosecution for advocating deliberate violence? Recent revelations of such advocacy of violence by an NFL coach should lead to his banishment for life by the NFL, and criminal prosecution by the authorities. If you are serious about reducing violence, you have to be serious about punishing those who advocate it. 

Have you noticed that what modest economic improvements we have seen occurred during the much-lamented “gridlock” in Washington? Nor is this unusual. If you check back through history, doing nothing has a far better track record than politicians’ intervening in the economy.

With all the talk about people paying their “fair share” of income taxes, why do nearly half the people in this country pay no income taxes at all? Is that their “fair share”? Or is creating more recipients of government handouts, at no cost to themselves, simply a strategy to gain more votes?

Some people are puzzled by the fact that so much that is said and done by politicians seems remote from reality. But reality is not what gets politicians elected. Appearances, rhetoric, and emotions are what get them elected. Reality is what the voters and taxpayers are left to deal with as a result of electing them.

Instead of following the tired old formula of having politicians and bureaucrats give college commencement speeches, in which they say how superior a career as a politician or bureaucrat — “public service” — is to other careers, why not invite someone like John Stossel to tell the graduates how much better it is to go into the private sector, where they can supply what people want, instead of imposing the government’s will on them?

In politics, few talents are as richly rewarded as the ability to convince parasites that they are victims. Welfare states on both sides of the Atlantic have discovered that largesse to losers does not reduce their hostility to society, but only increases it. Far from producing gratitude, generosity is seen as an admission of guilt, and the reparations as inadequate compensations for injustices — leading to worsening behavior by the recipients.
Some people say that taxes are the price we pay for civilization. But the runaway taxes of our time are the price we pay for being gullible.

Whatever the ideology or rhetoric of the political Left, their agenda around the world has been preempting other people’s decisions and regimenting other people’s lives.
People who believe in evolution in biology often believe in creationism in government. In other words, they believe that the universe and all the creatures in it could have evolved spontaneously, but that the economy is too complicated to operate without being directed by politicians.

The United States now has the dubious distinction of having the highest corporate-tax rate in the world. And people wonder why American corporations are expanding overseas, providing jobs to foreigners. The Left may get its jollies attacking “the rich,” but its real victims are other people, the ones who need the jobs that are sent overseas to escape a hostile business climate at home.

Different people prefer different exercises. The Republicans’ favorite exercise is running for the hills. The Democrats’ favorite exercise is kicking the can down the road.

When politicians say, “spread the wealth,” translate that as “concentrate the power,” because that is the only way they can spread the wealth. And once they get the power concentrated, they can do anything else they want to, as people have discovered — often to their horror — in countries around the world.

In an old Western movie, John Wayne encounters a black man. Wayne tells him, “I don’t have a prejudiced bone in my body. I would shoot you as quick as I would shoot any white man.” That is what equality is supposed to mean.
— Thomas Sowell is a senior fellow at the Hoover Institution. © 2012 Creators Syndicate, Inc.


Friday, June 26, 2015

Micro homesteading and permaculture FORBIDDEN lifestyles under Plan Bay Area


Both of these lifestyles are forbidden under the intensive Plan Bay Area planning approach which mandates urban boundaries and high density housing. Even progressives have their freedoms robbed with top down land use planning from regional bureaucrats.  It makes you wonder if alternative culture would have ever evolved in Marin if ABAG's Plan Bay Area existed fifty years ago.

A selectively golden state jobs outlook


A selectively golden state jobs outlook


Google I/O 2015 attendees the Moscone Center in San Francisco, Wednesday. A bug surge in technology employment helped the San Francisco-San Mateo top the charts of top U.S. metro areas for job growth.JEFF CHIU, ASSOCIATED PRESS
Follow OC Register Opinion to join the conversation

Every year, I, along with Pepperdine’s Michael Shires, have what has become the often-dispiriting job – for a 40-year California resident – of evaluating the nation’s metropolitan regions in terms of both short-term and midterm job growth. Yet, this year, the results for our state’s metros are somewhat improved, as California’s post-recession job-growth rate now equals, and could surpass, the still-somewhat insipid national average.
After years of subpar growth, California is reaping the advantages of a fortuitous economic alignment of ultralow interest rates, high stock values and growing investments in high-end residential real estate. Vast sums are pouring into the state for new tech ventures, speculative hotel and residential developments. Low borrowing rates allow the state to keep pace with its massive debts, while buoyant stocks help the massive government pension plans, which invest in the market.
Silicon Valley successes
The big winner, without question, has been the Bay Area. In our 2015 rankings of the 70 largest metropolitan areas, San Francisco-San Mateo holds first place, while the San Jose-Sunnyvale-Santa Clara area ranks No. 2. The job gains here are nothing short of explosive. From 2009-14, these two areas increased employment by more than 230,000 jobs, roughly a 20 percent jump. Tech employment drove this expansion, with information-sector jobs expanding well above 50 percent in each metro.
These gains dwarf anything else in a state where job growth has barely tracked the national average since 2007. It also is a unique boom, based largely on employment in social media and software. It stems from the unique presence of some of the world’s most powerful tech firms – Google, Apple, Intel, Facebook – attracting swarms of app-writers, consultants and business service providers.
How sustainable this boom will prove is clearly a big question. The area is certainly running up against limits to growth. Faced with some of the most Draconian planning edicts in the nation, the Bay Area simply has little room to grow, outside of building very high-density housing. This tends to make the prices for the housing most people prefer – single-family residences – extraordinarily expensive, which then also affects rents paid by those priced out of a purchase. This poses a major threat to Silicon Valley’s expansion, according to recent study done by the state, as it makes it very difficult for area companies to expand.
At the same time, there is growing opposition to attempts by tech firms to expand their physical presence. Companies like Google have engendered opposition over its proposed new headquarters expansion, and, in San Francisco, there is a growing unease over the influence of tech money on the venerable City by the Bay. Over time, as occurred in the past, we should expect much of the job growth in among Silicon Valley-based companies to occur outside the state, where the cost of everything – energy, housing, regulations – is far less onerous. But for right now, it’s “party on” time.
Mediocrity elsewhere
For the most part, you can’t really discern anything like a major boom in the state’s other big coastal metros. Outside the San Francisco-San Jose strip, not one of our biggest cities makes it in the U.S. top 20. The best performer, however, is in Orange County, where the metropolitan statistical area including Anaheim, Santa Ana and Irvine ranks 26th, up eight places from last year. Last year, the area enjoyed 3 percent job growth, but, since 2009, the total increase has been 11.8 percent, barely half that of the two big Bay Area economies.
But the O.C. did outperform San Diego (28th) and the third Bay Area metro, Oakland-Hayward-Berkeley (29th), which advanced two positions
Clearly, the tech revolution has not quite leapt too forcefully beyond the Bay, at least not yet.
The O.C. area also did somewhat better than Los Angeles (35th), which gained two places. L.A.’s job growth last year was only 2 percent. Noncoastal Sacramento (36th) gained nine places, but still lags a bit.
What accounts for this gap between the Silicon Valley-San Francisco boomtown and the state’s other major metropolitan areas? Perhaps the biggest explanation lies in the relatively meager expansion of information-sector employment in Los Angeles, up barely 3 percent since 2009; such jobs actually declined in the San Diego, Orange County and Oakland areas. At the same time, manufacturing jobs have continued to erode in Los Angeles, the nation’s premier industrial center, although they have rebounded somewhat in Oakland and Orange County after many years of losses.
I.E. surge
Perhaps the biggest surprise in our findings this year has been the clear resurgence of the Inland Empire. Often derided as too sprawling to succeed in the modern era, the San Bernardino-Riverside-Ontario area notched a very impressive 11th place, ahead of such longtime high-flyers as Dallas and Atlanta. One key factor may be housing costs that – although rising – are a bargain compared with the increasing unaffordable Southern California coastal counties.
The IE’s recovery has been surprisingly robust, up 4 percent last year and almost 15 percent since 2009, a gain of more than 150,000 jobs. This growth has been broad-based, including critical sectors, from construction and manufacturing to warehousing and business services. Information jobs declined, but this sector is relatively small in the Inland Empire compared with coastal areas.
Looking ahead
The big question facing California is whether the Bay Area boom will start to spread the wealth to other parts of the state. The Jerry Brown administration’s media admirers have proclaimed the state totally recovered, but the detritus of the recession remains: high welfare rates and continuing relatively high rate of unemployment and poverty. New initiatives to further tighten environmental rules could serve to slow growth, particularly in inland. State regulations against suburban housing and ever-rising energy costs (amid lower prices elsewhere) are likely to impact the poorer, more interior regions more severely than the increasingly gentrified coast.
The potential vulnerability of this bifurcated economy may not be fully realized until the current low-interest regime finally changes – making homes even more unaffordable – particularly along the coast, and as businesses begin to adjust to what seems to be an ever more Draconian planning regime. The essentially free money printed by the Federal Reserve and given to the investor class eventually will come with a cost. Companies that make no profit – and seem unlikely to ever do so – eventually will see a decline in capital lured by the promise of ever-increasing stock prices.
California has seen similar booms before, most recently in the middle of the prior decade, led by exploding prices for Google shares and relentlessly buoyant housing values, before slipping miserably during the ensuing downturn. The illusion of a great boom may help Gov. Brown and his followers sell their agenda, but only at the cost of future growth outside the Silicon Valley, and, eventually, perhaps there as well.
Joel Kotkin is the R.C. Hobbs Fellow in Urban Studies at Chapman University in Orange and the executive director of the Houston-based Center for Opportunity Urbanism (www.opportunityurbanism.org). His most recent book is “The New Class Conflict” (Telos Publishing: 2014).

Opinion: Will California use congestion to coerce motorists?

Opinion: Will California use congestion to coerce motorists?


Jerry Brown says NO to California car culture.  


Gov. Brown ignores traffic congestion in special session

New Caltrans plan seeks auto travel reduction

Plan opposes work to relieve jammed roads, highways


BY DAN WALTERS

dwalters@sacbee.com


When Jerry Brown staged a symbolic “groundbreaking” for his pet bullet train project in downtown Fresno five months ago, he traveled to his event by car.

He wasn’t alone. The 350 miles or so he traveled on his round-trip that day were a minute fraction of the approximately 900 million miles that California motorists drive on streets, roads and highways each day.

Or to put it another way, autos account for well over 90 percent of Californians’ transportation. Even the most optimistic projections of non-automotive travel say that’s unlikely to change much in the future as the state’s population and transportation demands continue to grow.

That fact and years of political neglect generate two problems – the nation’s worst traffic congestion and its third-worst pavement conditions.

Brown says he wants to do something about the state’s deteriorating roadways and has called a special legislative session to explore ways to put billions of dollars more into maintenance and reconstruction.

However, he is silent on congestion. The special legislative session may bring a simmering dispute over that facet of the transportation conundrum into sharper focus.

Three months ago, Brown’s Department of Transportation, fulfilling a 2009 legislative mandate, began circulating a draft of a California Transportation Plan, aimed at setting policy for the next quarter-century.

Citing California’s commitments to reducing greenhouse gases and improving access to non-automotive transportation, the CTP proposes to reduce automotive travel by increasing motorists’ taxes, flatly rejecting “road capacity enhancing strategies,” and urging the state to “avoid funding projects that add road capacity.”

Implicitly, therefore, it contends that increasing traffic congestion and the cost of driving would compel Californians to abandon their cars in favor of transit, bicycles and other non-automotive modes.

A punitive approach doesn’t sit well with the California Transportation Commission.

This month, the commission declared the CTP “is planning for significant actions that will fundamentally alter how Californians will utilize our transportation system” and urged that it balance “environmental goals with economic and mobility needs.”

The CTP, the commission says, puts too much emphasis on reducing automotive travel and too little on technological advances, such as electric cars, that could reduce fossil fuel use – Brown’s goal is a 50 percent cut – while maintaining personal mobility.

Californians support greenhouse gas reduction. But do they also want the state to compel them to change their lifestyles by parking their cars, jumping aboard trolley cars and bicycles, and trading their single-family homes for denser housing, as the CTP and other state policies assume they must?

It would be interesting to put that question on the ballot.

Read more here: http://www.sacbee.com/news/politics-government/dan-walters/article25192900.html#storylink=cpy

Thursday, June 25, 2015

Recommendations for buying a ladder truck. (Why it is crazy to put a 60 foot structure out at Grady Ranch)


Editor's Note: Grady Ranch is FOUR and Half times the distance as depicted in this video.
WHEN SHOULD YOU PURCHASE AN AERIAL LADDER?


09/01/1995


WHEN SHOULD YOU PURCHASE AN AERIAL LADDER?


BY HARRY R. CARTER, Ph.D.


The question "Does my community need an aerial ladder?" is not an easy one to answer. While researching this topic as a municipal fire officer and fire protection consultant, I discovered a mechanism for arriving at a series of answers to this question but no all-encompassing rule that could be offered for every situation.


For many years, it was thought that the answer to this question had a firm basis in fact. We were governed by the old rule-of-thumb that said an aerial ladder was necessary when five or more buildings of three stories or more in height or their equivalent were within a fire protection jurisdiction.


A recent phone call inquiring as to the exact citation of that recommendation touched off an extensive search of my personal library. It had been quite a while since someone had asked me to cite the source of that rule.


I found the citation under Section 540 of the Insurance Services Office (ISO) Fire Suppression Rating Schedule. It specifically states, "[R]esponse areas with 5 buildings that are 3 stories or 35 feet or more in height, or [have] 5 buildings that have a Needed Fire Flow greater than 3,500 gpm, or any combination of these criteria, should have a ladder company."


Is this all one needs to know to justify the need for an aerial unit in a community? I then asked myself. What about the communities that want more than just code and rating schedule quotations? Are there other criteria that could be used to back up the ISO recommendations?


SEARCH FOR ADDITIONAL CRITERIA


My search for additional criteria began in the same location at which many of our current standards and recommendations began their lives: the old American Insurance Association (AIA) Bulletins. AIA Special Interest Bulletin #69, "Fire Department Apparatus, Ladder and Elevating Platforms," addressed the issue of the appropriate ratio of aerial ladders to pumpers. This was a complementary reference to those remarks in the rating schedule that spoke of the need for a basic structural fire response of two pumper companies and a ladder or service company. I then selected data that could help broaden the basic requirements.


Some interesting clues related to the thinking of the individuals who developed this document were detected by reading between the lines. Relating to building conditions in the years following the Civil War, the bulletin stated: "As the height of buildings increased, it became evident that ladders long enough to reach the upper floors could not be handled by hand alone."


This seemingly urban problem from the 1870s and 1880s led to the development of an elevating ladder attached to a horse-drawn turntable vehicle. Thus, the aerial ladder was born. Undoubtedly, the debate over which fire departments should have one began at that point.


Since the ISO grading schedule speaks to how a unit becomes a rated aerial company, its existence is therefore acknowledged. And its guidelines give us a starting point. Unfortunately, we are still left with the question of how to further justify such an acquisition.


JUSTIFYING AN ACQUISITION


Whether to purchase an aerial ladder seems to be a local decision based on local building conditions. However, we have seen that many communities that did not need an aerial ladder had one and other communities that desperately needed one could not get one. What then to do?


These concerns led me to additional research and the development of the rules, given below, for determining if the acquisition of an aerial ladder or elevating platform device is warranted.


An aerial device is recommended when a number of buildings within the jurisdiction appear to be beyond the reach of existing fire department ground ladders. This recommendation is not only based on ISO recommendations but is a basic common-sense concept. If a significant number of your buildings are beyond the reach of your ground ladders, you had better do something about it.


The number of buildings beyond the reach of ground ladders in itself is not an absolute criterion; its significance will vary from community to community. For example, consider two communities, each of which has 15 buildings beyond the reach of a standard 35-foot portable ladder. The first is a farming community, and all 15 structures are barns or silos. The other community contains a series of apartment buildings, each more than 35 feet in height and housing approximately 40 residents. We can make a distinction in this case and would give an aerial to the latter.


In determining the need for acquiring an aerial device, we are not going to ignore the recommendations in the National Fire Protection Association`s Fire Protection Handbook, 17th edition, which recommends the following response patterns:


High-hazard occupancies (schools, hospitals, nursing homes, high-rise buildings): at least four pumpers, two ladder trucks, and other specialized apparatus as may be identified or available for the hazard.


Medium-hazard occupancies (apartments, offices, mercantile and industrial occupancies not normally requiring extensive rescue or firefighting capabilities): at least three pumpers, one ladder truck, and other specialized apparatus as may be identified or available.


Low-hazard occupancies (one-, two-, or three-family dwellings and scattered businesses and industrial occupancies): at least two pumpers, one ladder truck, and other specialized apparatus as may be identified or available.


Rural operations (scattered dwellings, small businesses, and farm buildings): at least one pumper with a large water tank (500 gallons or more), one mobile water supply apparatus (1,000-gallon or larger tank), and other specialized apparatus as may be necessary to perform effective initial firefighting operations.


These are excellent recommendations. However, as we have said, in many in-stances, the listing of a requirement or recommendation does not satisfy the incessant questioning of a municipal government official. That is the reason we are looking for actual physical criteria that can be used to justify acquiring such an expensive piece of firefighting equipment.


RULES GOVERNING THE ACQUISITION OF AN AERIAL DEVICE


l. Consider acquiring an aerial device when the portable ground ladders in your community will not reach the upper windows or roofs of buildings in your community. This is a simple but easily overlooked way to justify your need.


2. If you need long ladders and do not have enough people to raise them, consider an aerial ladder or elevating platform device.


Given that it takes four to six firefighters to raise and place a long ground ladder, ask the next question: Do you have enough people to lay out the attack and supply hoselines and raise a long ground ladder? This fact is fairly easy to establish.


A review of existing records can tell you how many people in your community respond during the various time periods. In almost every one of my consulting assignments over the past 15 years, there has been a diminished staffing level during the 0700-1700 hours time frame. This condition is especially prevalent in small fire departments. If you do not have the people, you cannot raise the ground ladders.


3. If the terrain and topography in a community rule out using ground ladders, you must consider aerial devices. Topographical and landscaping oddities may prevent the firefighters from approaching from the two-story side of two-story structures, such as townhouses, to raise ground ladders. In addition, Queen Anne (Victorian) homes--although not common in every U.S. community--do not provide good access for roof operations. In these situations, an aerial device would be needed to make the necessary rescues or accomplish ventilation operations.


William E. Clark, in both editions of Firefighting Principles and Practices (Fire Engineering Books), refers to such problems of access, terrain, and topography. If you cannot reach the roofs and upper floor windows by means of a ground ladder, you must opt for the aerial.


OTHER OPTIONS


The citizens expect you to be able to reach them in times of emergency--regardless of structure height or other access difficulties. If your community needs an aerial device but has an insufficient workload to justify the expense of purchasing one or cannot afford to buy one, consider a mutual-aid or regional purchase agreement (all parties in need of the aerial device share in the cost and one department serves as the host agency). When contracting with another department, be sure to work out agreement details before the need for the device arises and develop a written contract establishing procedures for requesting and providing aid and the equipment/services (or money) that will be offered in return for use of the aerial.


By sharing an aerial device with neighboring departments under an automatic-aid agreement, a fire department can lower its ISO rating (and consequently insurance rates). Under the automatic-aid agreement, a department arranges in advance to have another department`s assets (equipment, personnel, or both) automatically respond to a call in the contacting department`s territory; no request must be made at the time of the emergency (as must be done in a mutual-aid arrangement). Fire departments can receive up to 90 percent of the full credit (points) they would have received under the ISO Fire Suppression Rating Schedule if they owned the equipment. The number of credits that can be earned depends on the alarm receipt/dispatch, fireground communications, and joint-training arrangements between the aiding and aided departments. (See "Fire Suppression Rating Schedule,"by Dale Perry, Fire Engineering, June 1995, page 10.)


* * *


If you have developed a tight package of justifications, have sold the proposal to the powers that be (if you are a municipal fire department), and have sold it to the citizens in your community and still have not been able to gain approval for the funding of the level of fire protection you consider to be adequate, keep the paperwork, for there is always next year. n


HARRY R. CARTER, Ph.D., is a battalion chief with the Newark (NJ) Fire Department, a past chief of the Adelphia (NJ) Fire Department, and a fire protection consultant based in Adelphia.

Will we need a new Fire Ladder Company to fight fires at Marinwood Village ? We will DEFINITELY need one for Grady Ranch at 60 feet tall


Ladder Trucks are recommended for fighting fires in buildings above 35 feet high.
 Marinwood Village is 46 feet high at the highest point according to Bridge Housing plans.  Grady Ranch is 60 feet tall.

Ladder trucks can save lives.  This 4 story apartment fire appears to be a total loss. Imagine the catastrophe awaiting a 6 story apartment building  filled with seniors and disabled citizens. It will be a slow response time with trucks arriving from Novato and San Rafael.  Grady Ranch is 4 1/2 miles from the 101 freeway.
No ladder trucks can be seen in this photo.

Ladder trucks cost millons to buy, maintain, house and operate.

Ladder trucks and trained ladder companies are an enormous expense to the community.

New ladder trucks over a million dollars and they require additional trained fire staff to operate safely.  Marinwood Fire Department will be required to build a new fire station to house the equipment and the additional personnel. 

Our 11 man Marinwood Fire department budget consumes well over half of our 4.2 million dollar annual budget. Marinwood/Lucas Valley/ CSA 13 taxpayers pay some of the highest parcel taxes for fire service in all of Marin

Clearly more high density housing will cost this community dearly and new taxes will be needed for this expansion.  The Marinwood Village low income development will pay little taxes for their 82 units of family housing. According to Brad Wilban, Bridge Housing VP it will be approximately $142 per housing unit or $10,000 per year.  Many of us pay close  $10,000 for ONE HOUSE!!

A financial analysis of our Firefighting readiness and a financial analysis of costs are needed before considering the current Marinwood Village high density housing plans. 

If you question the wisdom of having a 3-4 story apartment building in our community without the fire safety equipment and trained personnel to keep our neighbors safe.  If you are upset that you will need to pay additional taxes to subsidize the Marinwood Village "big box" apartments,  please join "Save Marinwood"  to urge  sensible growth and wise land use.  Our County Supervisors must hear us.

Will residents living on the third floor of Marinwood Village be safe if the closest ladder trucks are miles away in other communities? How about the remote Grady Ranch with six stories?  


For more information see: When should you buy an aerial ladder

Marin City Residents talk about preserving Golden Gate Village June 22, 2015.


Wednesday, June 24, 2015

CDA Administrative Decision letter to Applicant: Skywalker Properties- / PEP Housing: re: Grady Ranch Pre-Application.


 CDA Administrative Decision letter to Applicant: Skywalker Properties- / PEP Housing: re: Grady Ranch Pre-Application.


The CDA letter gives an overview of the history of the property, including the most recent Grady Ranch 1996  Masterplan and provides CDA's review that a full Masterplan Amendment and SEIR would be required for the proposed project.

Details of the Pre-Application Plans, such as the 60' building height, are also described: 
A "must read!"

Link to the Count Webpage for Grady Ranch is HereL 


County Planning link to the Skywalker project plans, updated whenever changes are made:

http://www.marincounty.org/depts/cd/divisions/planning/projects/lucas-valley/skywalker-properties-ltd_pr_15_0117_sr

THE COSTS OF SMART GROWTH REVISITED: A 40 YEAR PERSPECTIVE

THE COSTS OF SMART GROWTH REVISITED: A 40 YEAR PERSPECTIVE

london-housing.jpg
"Soaring" land and house prices "certainly represent the biggest single failure" of smart growth, which has contributed to an increase in prices that is unprecedented in history. This  finding could well have been from our new The Housing Crash and Smart Growth, but this observation was made by one of the world's leading urbanologists, Sir Peter Hall, in a classic work 40 years ago. Hall led an evaluation of the effects of the British Town and Country Planning Act of 1947 (The Containment of Urban England) between 1966 and 1971. The principal purpose of the Act had been urban containment, using the land rationing strategies of today's smart growth, such as urban growth boundaries and comprehensive plans that forbid development on large swaths of land that would otherwise be developable.
The Economics of Urban Containment (Smart Growth): The findings of Hall and his colleagues were echoed later by a Labour Government report in the mid-2000s which showed housing affordability had suffered under this planning regime. Author Kate Barker was a member of the Monetary Policy Committee of the Bank of England, which like America's Federal Reserve Board, is in charge of monetary policy. Among other things, the Barker Reports on housing and land use found that urban containment had driven the price of land with "planning permission" to many multiples (per acre) above that of comparable land where planning was prohibited. Under normal circumstances comparable land would have similar value.
Whether coming from the left or right, economists have demonstrated that prices tend to rise when supply is restricted, all things being equal.  Certainly there can be no other reason for the price differentials virtually across the street that occur in smart growth areas. Dr. Arthur Grimes, Chairman of the Board of New Zealand's central bank (the Reserve Bank of New Zealand), found the differential on either side of Auckland's urban growth boundary at 10 times, while we found an11 times difference in Portland across the urban growth boundary. 
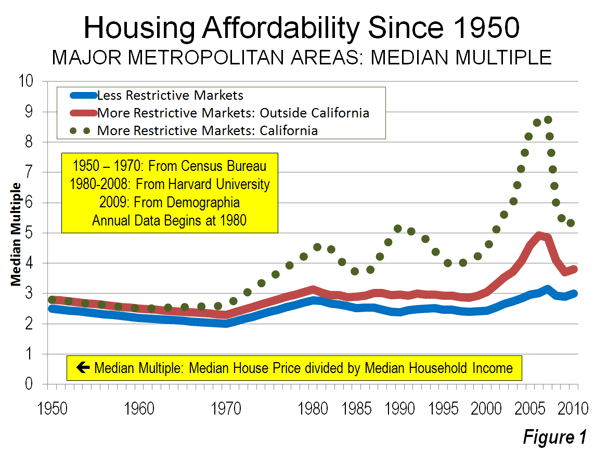
House Prices in America: The Historical Norm: Since World War II, median house prices in US metropolitan areas have generally been between 2.0 and 3.0 times median household incomes (a measure called the Median Multiple). This included California until 1970 (Figure 1). After that, housing became unaffordable in California, averaging nearly 1.5 times that of the rest of the nation during the 1980s and 1990s (adjusted for incomes). Even after the huge price declines from the peak of the bubble, house prices remain artificially high in Los Angeles, San Francisco, San Diego and San Jose, with median multiples of six or higher.
William Fischel of Dartmouth University examined a variety of justifications for the disproportionate rise of California housing prices and dismissed all but more restrictive land use regulation. He noted that "growth controls (restrictive land use regulations) have the undesirable effect of raising housing prices." Throughout the rest of the nation, more restrictive land use regulations have been present in every market where house prices rose substantially above the historic Median Multiple norm, even during the housing bubble. No market without smart growth has ever reached these heights.
Setting Up for the Fall: Excessive Cost Increases in Smart Growth Markets: The Housing Crash and Smart Growthpublished by the National Center for Policy Analysis, examined the causes of house price increase during the housing bubble. The analysis included all metropolitan areas with more than 1,000,000 population. It focused on 11 metropolitan areas in which the greatest cost increases occurred (the "ground zero" markets), comparing them to cost increases in the 22 metropolitan areas with less restrictive land use regulation (Note 1).
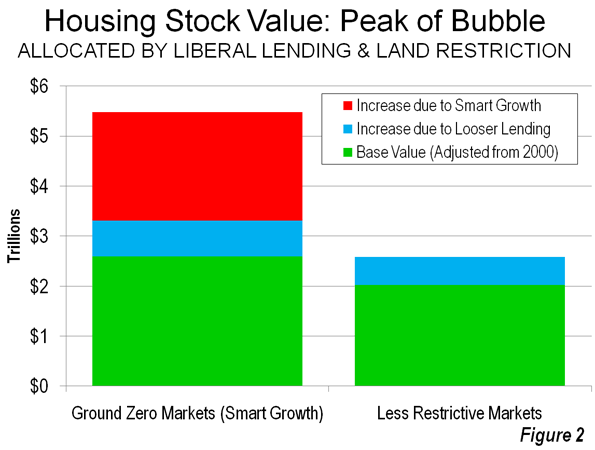
  • Less Restrictively Regulated Markets: In the less restrictively regulated markets, the value of the housing stock rose approximately $560 billion, or 28 percent from 2000 to the peak of the bubble (Note 2). In nearly all of these markets, the Median Multiple remained within the historical range of 2.0 to 3.0 and none approached the high Median Multiples that occurred in the "ground zero" markets.
  • Ground Zero Markets The value of the housing stock rose $2.9 trillion from 2000 to the peak of the bubble in the "ground zero" markets, all of which have significant land use restrictions (Note 3). The 112 percent increase in the "ground zero" markets was four times that of the less restrictively regulated markets. The Median Multiple rose to unprecedented levels in each of the "ground zero" markets, peaking at from 5.0 to more than 11.0, four times the historic norm.
The 28 percent increase in relative house value that occurred in the less restrictively regulated markets (those without smart growth) is attributed to the influence of loosened lending standards. The excess above 28 percent, which amounts to $2.2 in the "ground zero" markets is attributed to to the supply restricting strategies of smart growth (Figure 2).


The Fall: Smart Growth Losses
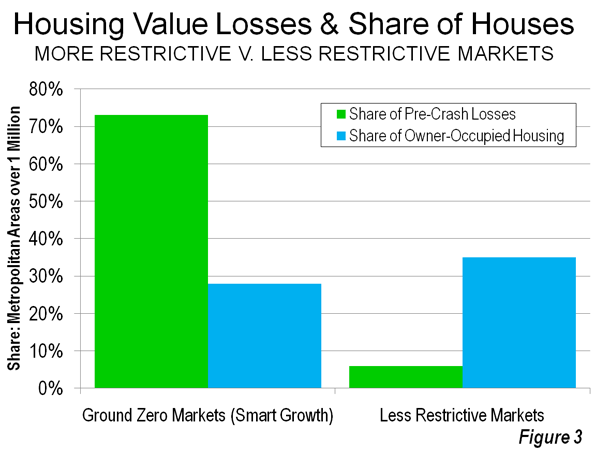
The largest house price drops occurred in the markets that had experienced the greatest cost escalation, both because prices were artificially higher but also because prices in smart growth markets are more volatile.  The "ground zero" markets, with only 28 percent of the owner occupied housing stock, accounted for 73 percent of the pre-crash losses ($1.8 trillion). Thus, much of the cause of the housing crash, which most analysts date from the Lehman Brothers bankruptcy (September 15, 2008), can be attributed to these 11 metropolitan areas.
By contrast, the 22 less restrictively regulated markets accounted for only six percent ($0.16 trillion) of the pre-crash losses. These 22 markets represented 35 percent of the owned housing stock (Figure 3).


If the losses in the ground zero markets had been limited to the rate in the less restrictively regulated markets (the estimated impact of cheap credit), losses would have been $1.6 trillion less (Note 4). The Great Recession might not have been so "Great."
Economic Denial and Acknowledgement: In his writing forty years ago, Dr. Hall noted that English planners denied the connection between the unprecedented house price increases and urban containment. This same denial also informs smart growth advocates today. This is perhaps to be expected, because, as Hall noted 40 years ago, an understanding of the longer term consequences would have undermined support for these policies.
To their credit, some advocates recognize that smart growth raises house prices. The Costs of Sprawl – 2000¸ a volume largely sympathetic to smart growth, also indicates that urban containment strategies can raise housing prices. The only question is how much smart growth raises house prices. The presence of urban containment policy is the distinguishing characteristic of metropolitan markets where prices have escalated well beyond the historic norm.
The Social Costs of Smart Growth: Moreover, the social impacts of smart growth are by no means equitable. Peter Hall says that the "less affluent house-owner ... has paid the greatest price for (urban) containment" (Note 5). He continues: "there can be little doubt about the identity of the group that has got the poorest bargain. It is the really depressed class in the housing market: the poorer members of the privately-rented housing sector." Finally, Hall laments as well the impact of these policies on the "ideal of a property owning democracy."
Hall's four decades old concern strikes a chord on this side of the Atlantic. Just last week, a New York Times/CBS News poll found that nine out of ten respondents associated home property ownership with the American Dream. Planning needs to facilitate people's preferences, not get in their way.
--------
Note 1: The housing stock value uses a 2000 base, which adjusts house prices based upon the change in household incomes to the peak.
Note 2: The underlying demand for housing was substantial in some of the less restrictively markets, which is illustrated by the strong net domestic migration to metropolitan areas such as Atlanta, Austin, Dallas – Fort Worth, Houston, Raleigh and San Antonio. At the same time, some more restrictive markets (smart growth) that hit historically experienced strong demand were experiencing huge domestic outmigration, indicating little in underlying demand. This includes Los Angeles, San Francisco, San Diego and San Jose. Demand, however is driven upward in more restrictively metropolitan areas by speculation which, according to the Federal Reserve Bank of Dallas is attracted by supply constraints.
Note 3: The 11 "ground zero" metropolitan markets were Los Angeles, San Francisco, San Diego, San Jose, Sacramento, Riverside-San Bernardino, Las Vegas, Phoenix, Tampa-St. Petersburg, Miami and the Washington, DC area.
Note 4: The pre-crash losses in the 18 other restrictively regulated markets were $0.5 trillion. These markets accounted for 37 percent of owner occupied housing in the metropolitan areas of more than 1,000,000 population, compared to 35 percent in the less restrictively regulated markets, yet had losses three times as high.
Note 5: The Containment of Urban England also indicates that new house sizes have been forced downward by the planning regulations (see photo at the top of the article).
Photograph: New, smaller exurban housing in the London area (by author)
Wendell Cox is a Visiting Professor, Conservatoire National des Arts et Metiers, Paris and the author of “War on the Dream: How Anti-Sprawl Policy Threatens the Quality of Life

Tuesday, June 23, 2015

State Assembly approves plan to bring back Kelo-style redevelopment

State Assembly approves plan to bring back Kelo-style redevelopment

Sacramento_CapitolRedevelopment agencies would once again have the power to seize private property for big developers under a bill that passed the California State Assembly earlier this month.
Assembly Bill 2, authored by Assemblyman Luis Alejo, D-Salinas, would give local governments the power to create new entities that would have the same legal authority as redevelopment agencies. These new Community Revitalization Investment Authorities would have the power to issue bonds, award sweetheart deals to businesses and “acquire and transfer property subject to eminent domain,” according to the legislative analysis of the bill.
Property rights advocates warn that the bill’s language contains no restrictions on eminent domain and could resurrect the abuses made possible by the Supreme Court’s controversial Kelo decision.
“It brings back the right of governments to exercise eminent domain against some private parties in order to resell their property to other private parties,” cautioned Howard Ahmanson, Jr., a property rights advocate and founder of Fieldstead and Company. “Only new and wealthy suburbs would be potentially spared from ‘redevelopment,’ the lower middle class and poor would not.”

12 Assembly Republicans back redevelopment, unrestricted eminent domain

In 2005, the U.S. Supreme Court ruled in Kelo v. New London that government agencies have the power to seize property for economic development. The decision was widely criticized across the political spectrum and inspired states to pass tougher laws limiting governments’ eminent domain powers. Here in California, the momentum for property rights reached its zenith in 2011, when Gov. Jerry Brown pushed through a plan to end redevelopment as part of his plan to balance the state budget.
Kristin_Olsen_PictureNow a decade since Kelo, the horror stories of small businesses being seized to make way for strip malls and condo complexes have faded from public memory. During the state Assembly’s floor debate on the bill, not a single member – Republican or Democrat – spoke in opposition to the bill, which passed by a 63-13 vote.
Surprisingly, a dozen Assembly Republican lawmakers, including Assembly GOP leader Kristin Olsen, joined the Democratic majority in backing the bill. Olsen’s office refused to comment on the bill or explain how the bill fit with the Republican Caucus’ position on property rights. One GOP lawmaker defended her vote by arguing that redevelopment agencies are an important tool for economic development.
“I ran for Assembly to help create jobs,” said Assemblywoman Young Kim, R-Fullerton. “RDAs give us another tool to do just that while turning around poor and disadvantaged areas.”

Redevelopment focused in areas with high unemployment, crime

Under the bill, a Community Revitalization Investment Authority could be created by a city, county or special district if certain conditions are met. The first requirement is that the area have an annual median household income that is less than 80 percent of the statewide median. Additionally, three of the following four conditions must be met:
  • Unemployment that is at least 3 percent higher than the statewide median unemployment rate;
  • A crime rate that is 5 percet higher than the statewide median crime rate;
  • Deteriorated or inadequate infrastructure such as streets, sidewalks, water supply, sewer treatment or processing, and parks;
  • Deteriorated commercial or residential structures.
“It’s redevelopment with a kinder, gentler twist,” explains Steven Greenhut, the state’s foremost expert on eminent domain and author of the book, Abuse of Power: How the Government Misuses Eminent Domain. “If AB2 passes, agencies will take property by eminent domain and use public dollars to fund private projects. Localities will run up debt without a vote of the public. As always, the plans of residents will give way to the edicts of the planners.”
There’s overwhelming evidence that redevelopment agencies harm small businesses, while failing in their mission to stimulate economies. That’s most evident in the landmark Kelo case, where a Connecticut town offered a corporate welfare package to the pharmaceutical giant Pfizer, Inc.
“While Ms. Kelo and her neighbors lost their homes, the city and the state spent some $78 million to bulldoze private property for high-end condos and other ‘desirable’ elements,” the Wall Street Journal observed in 2009. “Instead, the wrecked and condemned neighborhood still stands vacant, without any of the touted tax benefits or job creation.”
Those abuses extended to California’s application of redevelopment, property rights advocates say.
“California has rightly earned the reputation as one of the nation’s largest abusers of eminent domain, given that Redevelopment Agencies routinely abused their power of eminent domain to seize homes, small businesses and places of worship for private development,” wrote the California Alliance to Protect Private Property Rights, the state’s leading property rights group. “Time and time again, these obscure agencies diverted taxpayer dollars from core government programs to finance professional sports arenas, luxury hotels, golf courses and strip malls.”

Alejo: Bill needed to help disadvantaged communities

Nevertheless, supporters of AB2 say that blighted areas are a problem that demand government action.
“There are many areas in the state where the streets are broken and old water and sewer pipes lurk below,” Alejo said of his legislation. “In these areas, businesses do not open up shop. This leads to high unemployment, high crime rates and a hopeless community. This bill will work to tackle issues facing our state’s most disadvantaged communities.”
Several GOP lawmakers that opposed the bill dispute Alejo’s arguments.
“Private property rights are a foundational principle declared by our founding fathers,” said Asm. Scott Wilk, R-Santa Clarita, who opposed the bill. “Eminent domain is used by the government to trample on private property rights and as an individual property owner, there are legal protections in place to prevent government encroachment.”
Assemblywoman Melissa Melendez, R-Lake Elsinore, one of only 13 members to oppose the bill, said that she understands her colleagues interest in redevelopment, but can’t back legislation that undermines property rights.
“Stripping away property rights in the name of economic development isn’t the answer,” said Melendez, a former member of the Lake Elsinore City Council. “I think it has become more fashionable to allow the government to take over instead of allowing the free market to do so.”