Saturday, October 27, 2018
Friday, October 26, 2018
Why People are moving to their hometowns and starting businesses
THE GREAT RE-HOMING: WHY PEOPLE ARE MOVING BACK TO THEIR HOMETOWNS TO START SMALL BUSINESSES
by Pablo Fuentes 08/28/2018

I have my gas station diet down pat. Coffee, water, bananas, nuts, hard-boiled eggs, and the occasional peanut butter cup indulgence. Ok, sometimes I also eat beef jerky. You have to learn these things when you spend 10,000 miles on the road talking to small business owners for a podcast.
After over 90 episodes of Small Business War Stories, a few things have happened. First, I started sucking a little less at interviewing people. Turns out it’s not as easy as it seems. But more importantly, I started noticing patterns and lessons in people’s stories. I am collecting many of those in my upcoming book.
The most interesting trend I noticed was small business entrepreneurs returning to the communities where they came from. There is an invisible shift happening where people who once wanted to spread their proverbial wings somewhere else are returning to their hometowns to make things happen. This has always been the case to some extent, but I believe that technology is enabling people to be successful in ways that were very difficult or impossible just a decade ago.
Why are people coming home? After all, at some point they left for the allure and glitz of a larger city, a greener pasture, a shinier future, a perceived better career.
Well…a few reasons:
1) Lower Cost of Living
As a wise man once said… the rent is too damn high! Most people leaving their hometowns make sacrifices in search of a career, a lifestyle, or simply to get out of the place they grew up. Adventure calls! Fortune favors the bold! 50% of your income to live in a shared shoebox? Sure! Do they take cats?
For example, Seth Lee Jones (episode 021) ventured out West to Los Angeles from Tulsa, Oklahoma in his early twenties to learn music. But when it came down to starting his own guitar-making and repair business (and his music career) in his thirties, he returned to his roots. Now he has a great house in Tulsa with a lot of history in a cool part of town for the price of a storage shed in California.
Returning to communities with a lower cost of living gives people a better chance of succeeding by keeping costs low. This can be the difference between getting through a rough patch and going back to working a dead-end job. Because of his skills and popularity on social media platforms, Seth gets customers from far and wide to buy his guitars and his music. He is selling globally, and living locally. You can check him out Monday nights at The Colony, a bar in Tulsa.
2) Community and Belonging
I believe that people can successfully build community anywhere if they set their mind and soul to it. But in my experience, it’s a bit easier in places with a bit of a slower pace of life. When there are fewer competing interests and lower stress, it’s just a little easier to stop and smile at a stranger and to remember the name of the barista who pours your coffee.
There is something special about feeling like you’re a part of the community. And it’s a bit easier to make an impact on a smaller community, especially where you grew up.
This feeling inspired another podcast guest, Cali Noland (episode 034) to move back to Clarksdale, Mississippi after college to start Meraki Coffee Roasters, and its associated non-profit, Griot Arts. Together with her business partner, Ben Lewis, Cali and Meraki roast coffee in the heart of the Mississippi Delta. But the twist is that through their business, they seek to train Delta youth in business and life skills.
Meraki sells coffee in downtown Clarksdale, but like Seth Lee Jones and his guitars, they also sell their coffee beans worldwide. They are able to make a local impact by using technology to appeal to a geographically-diverse customer base. People buy the coffee because it’s great…but also because they can make a difference in the Mississippi Delta, the birthplace of blues music and culture.
3) Technology Changes Everything
Technology is changing the way we relate to our environment. This can be bad, in the sense that it seems like everyone is on their phone all the time. But it can also be good, in the sense that it allows people to make a living pretty much anywhere.
Technology is enabling people to get more creative about how (and where) they make money. Tools such as Slack, Google Meetings, and good ol’ email allow people to collaborate with remote teams. Craftspeople can get a following on Instagram, sell their wares on Etsy, and work with a number of different on-demand shipping companies to get their products to their final destination. It’s easy to take these things for granted, but many of these tasks were much more difficult, if not impossible, as little as a decade ago.
The development of technology will continue to create flexible opportunities. From distance learning, to even more remote office connectivity, to deeper broadband Internet reach, the future is bright for people with initiative and flexibility. That means more opportunities for people to live where they want and do what they like.
I have a strong intuition that this trend will continue over the next few decades. States like Vermont are piggybacking on this trend by offering people $10,000 to move there. Smaller communities will continue to attract people with their lower cost of living, higher quality of life, and an inviting environment to thrive as small businesses and as involved members of their communities.
In the meanwhile, I’ll continue to drive far and wide in search of good stories for the podcast; I never cease to be amazed by what I learn from the small business owners and operators who make up the heartbeat of America.
Pablo Fuentes is the Founder and CEO of Proven, a company that helps small businesses hire with easy-to-use software. He is proud of his company’s blog, which helps small businesses with fun things like finding the Best Small Business Podcasts, and useful but less fun things like finding the Best Applicant Tracking System
Thursday, October 25, 2018
Pessimism Viewed in Historical Perspective
Pessimism about potentially life-enhancing technologies is not new.
|
@chellivia

Pessimism about potentially life-enhancing technologies is not new. The Twitter account Pessimist’s Archive (a favorite of the internet guru Marc Andreessen) chronicles the unending stream of pessimism with old newspaper excerpts.
Pessimistic reactions range from merely doubtful (such as this response to the idea of gas lighting in 1809, or this one to the concept of anesthesia in 1839) to outright alarmist (such as this 1999 warning that e-commerce “threatens to destroy more than it could ever create”).
In some cases, the pessimists insist that an older technology is superior to a new one. Some, for example, claimed that an abacus is superior to a computer and a pocket calculator, while others claimed that horses are longer-lasting than the dangerous “automobile terror.”
Others argue that new technology is damaging existing businesses and customs. One particularly emotional 1918 article described how automobiles are destroying the livery stable business and, together with “the movie show,” changing dating forever by ending the tradition of romantic carriage rides.
Another frequent complaint is that new technology exacerbates inequality, because the wealthy tend to adopt new technologies first. One article from 1914, for example, laments that “wireless telephones” will only ever “be a boon to privileged persons.” The article was referring to the early wireless radiotelephones being developed at that time, which were not lightweight handheld devices. Today, of course, wireless phones can fit in your pocket, have many more capabilities, and are ubiquitous. Eventually, the free market tends to drive down the cost of technologies, making them accessible to more people.
Perhaps what is most remarkable about pessimistic responses to new technology is how often the pessimists successfully use the power of the state to try to halt technological progress.
In the 1930s, pessimists feared that radios were a threat to democracy and worried that the devices were ruining childhood. By 1936, the pessimists had succeeded at banning radios in cars in a number of U.S. cities, arguing that they were distracting and might prevent drivers from hearing fire engine sirens.
Sadly, techno-pessimists have managed to enact bans or partial bans on a great variety of technologies. These include “horseless carriages” (cars), “automatic lifts” (elevators), and bicycles (which are “the most dangerous thing to life and property ever invented” according to an 1881 New York Times article). The list also includes, more recently, video games, headphones, and hover-boards.
As new breakthroughs continue to occur practically every day, looking back at how people decried and fought against progress in the past helps put current technological and scientific debates in perspective.
Chelsea Follett is the managing editor of HumanProgress.org.
Pessimism Viewed in Historical Perspective
By Chelsea Follett|
@chellivia
Pessimism about potentially life-enhancing technologies is not new. The Twitter account Pessimist’s Archive (a favorite of the internet guru Marc Andreessen) chronicles the unending stream of pessimism with old newspaper excerpts.
Pessimistic reactions range from merely doubtful (such as this response to the idea of gas lighting in 1809, or this one to the concept of anesthesia in 1839) to outright alarmist (such as this 1999 warning that e-commerce “threatens to destroy more than it could ever create”).
In some cases, the pessimists insist that an older technology is superior to a new one. Some, for example, claimed that an abacus is superior to a computer and a pocket calculator, while others claimed that horses are longer-lasting than the dangerous “automobile terror.”
Others argue that new technology is damaging existing businesses and customs. One particularly emotional 1918 article described how automobiles are destroying the livery stable business and, together with “the movie show,” changing dating forever by ending the tradition of romantic carriage rides.
Another frequent complaint is that new technology exacerbates inequality, because the wealthy tend to adopt new technologies first. One article from 1914, for example, laments that “wireless telephones” will only ever “be a boon to privileged persons.” The article was referring to the early wireless radiotelephones being developed at that time, which were not lightweight handheld devices. Today, of course, wireless phones can fit in your pocket, have many more capabilities, and are ubiquitous. Eventually, the free market tends to drive down the cost of technologies, making them accessible to more people.
Perhaps what is most remarkable about pessimistic responses to new technology is how often the pessimists successfully use the power of the state to try to halt technological progress.
In the 1930s, pessimists feared that radios were a threat to democracy and worried that the devices were ruining childhood. By 1936, the pessimists had succeeded at banning radios in cars in a number of U.S. cities, arguing that they were distracting and might prevent drivers from hearing fire engine sirens.
Sadly, techno-pessimists have managed to enact bans or partial bans on a great variety of technologies. These include “horseless carriages” (cars), “automatic lifts” (elevators), and bicycles (which are “the most dangerous thing to life and property ever invented” according to an 1881 New York Times article). The list also includes, more recently, video games, headphones, and hover-boards.
As new breakthroughs continue to occur practically every day, looking back at how people decried and fought against progress in the past helps put current technological and scientific debates in perspective.
Chelsea Follett is the managing editor of HumanProgress.org.
DISPERSED AMERICAN URBAN FORM YIELDS QUICK WORK TRIPS
DISPERSED AMERICAN URBAN FORM YIELDS QUICK WORK TRIPS
by Wendell Cox 08/09/2018

Planners and journalists are often uneasy about suburban development, wondering how people will get to work in the center from more distant locations. They needn’t worry. Only a relatively small percentage of people work in the center (generally less than 10 percent). Indeed the residential employment dispersion in American metropolitan areas has been a major factor in keeping work trip travel times among the shortest in the world.
In a ground breaking 2007 research paper, economists Bumsoo Lee and Peter Gordon cited William T. Bogart, now president of Maryville College (Tennessee), to dismiss the pervasive idea in planning, media and academic circles that American metropolitan areas (cities in their economic or functional form) still exhibit the monocentric form that ceased to be long ago.
“A fundamental misunderstanding of how metropolitan areas work has hampered the current debate on the causes and consequences of urban sprawl. This misunderstanding is analogous to the pre-Copernican fallacy that the earth is the center of the universe, and everything revolves around the earth. In the discussion of urban sprawl, the downtown or central city takes the place of the earth in the Ptolemaic cosmology, and the rest of the metropolitan area is defined only in relation to the downtown.”
In their research, Lee and Gordon showed that as early as 2000, no major metropolitan area (over 1 million population) in the United States had a monocentric employment pattern. Indeed, they showed that US metropolitan areas were already more polycentric than monocentric. That includes New York, where more than 75 percent of employment was outside the monocentric core (the central business district or CBD) and other major subcenters.
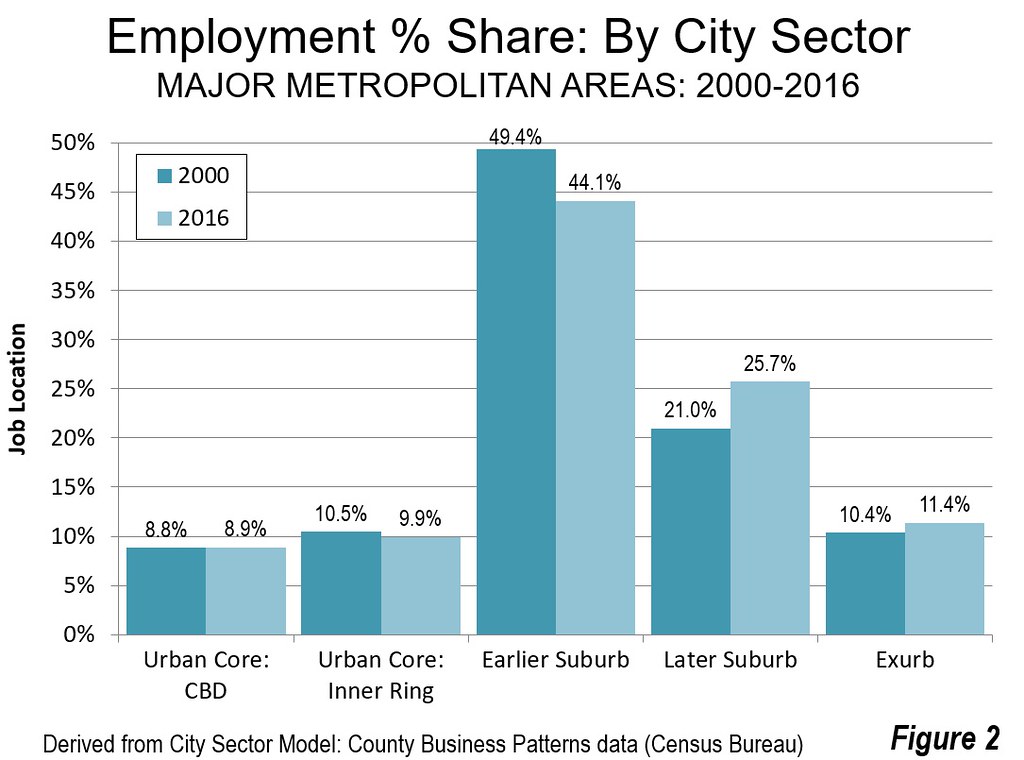
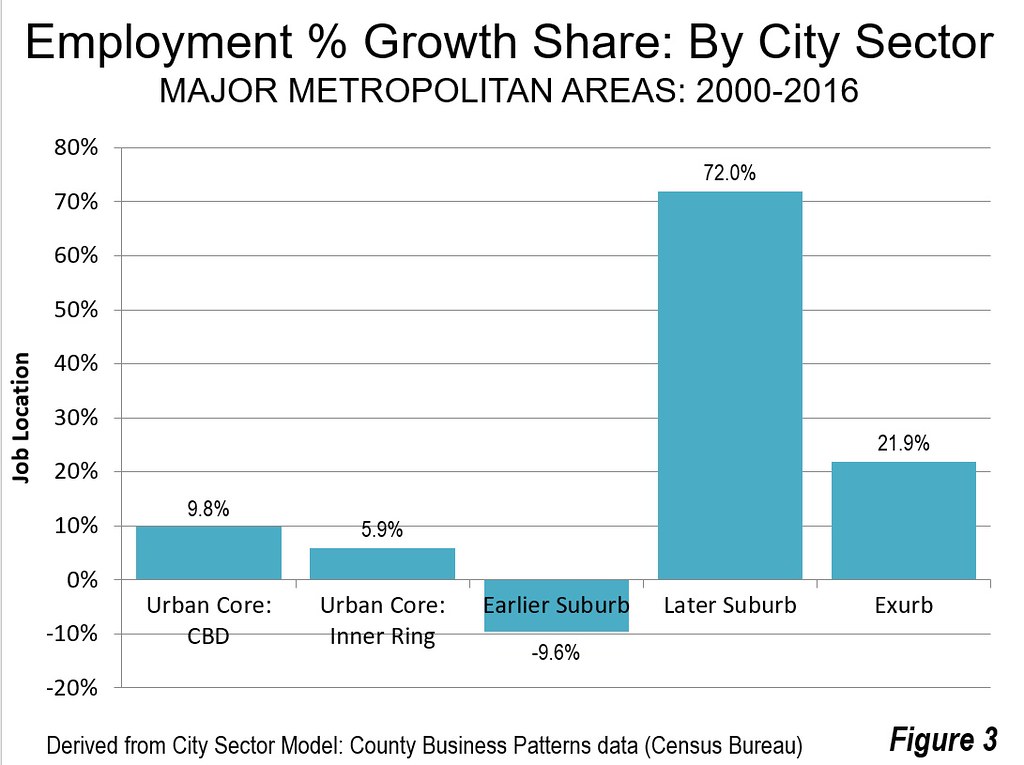
But the real momentum is beyond polycentrism, to dispersal outside of even suburban business centers. (Figure 1). Earlier, Gordon and Harry Richardson showed that Los Angeles had left polycentricity behind for a dispersed urban form by 1990. Although the Lee and Gordon research has not been updated, the most recent Census Bureau County Business Patterns data shows that 94 percent of new employment has been located in two outer sectors (Later Suburbs & Exurbs) since 2000 (Figures 2 & 3).
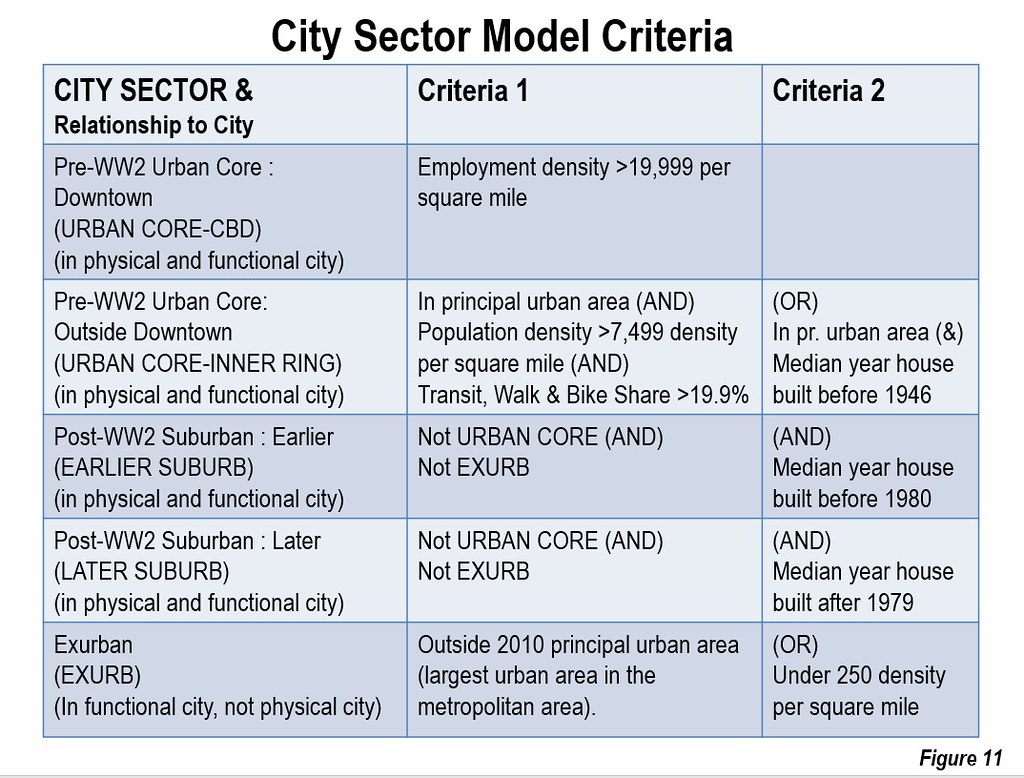
This analysis uses the City Sector Model and American Community Survey (2012-2016) to estimate average work trip travel times for 2016 for sectors within major metropolitan areas (See Note and Figure 11). This demonstrates that across the entire US metropolitan area, average one-way work trip travel times are around 30 minutes or less.
Evenly Dispersed Residences & Employment
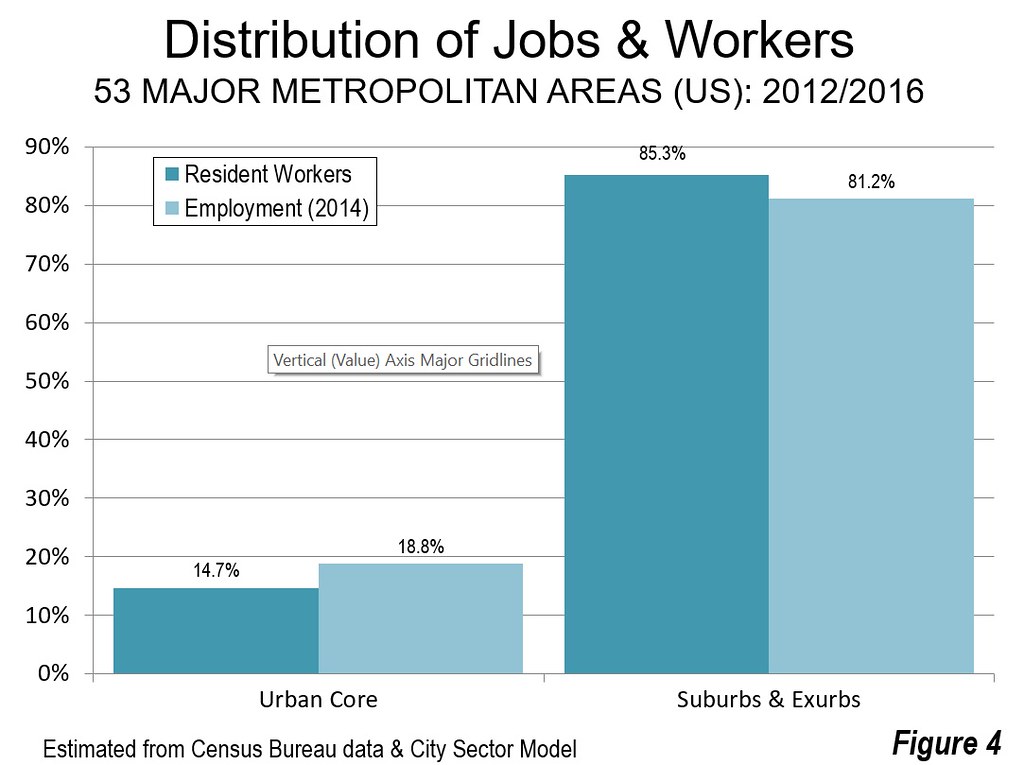
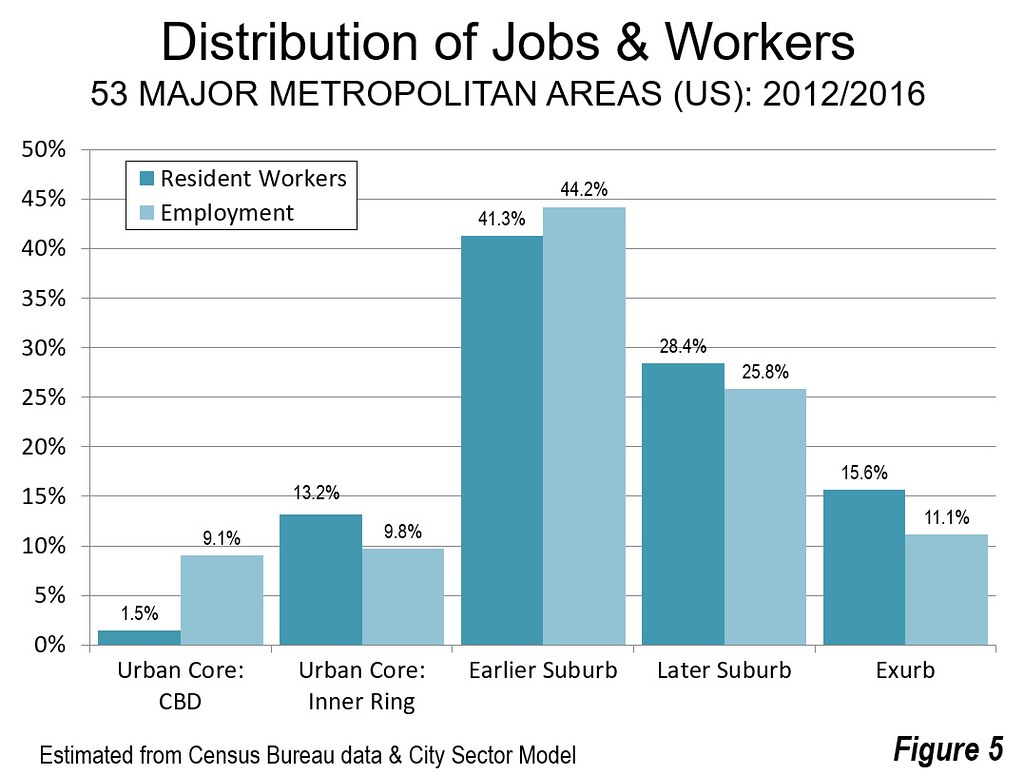
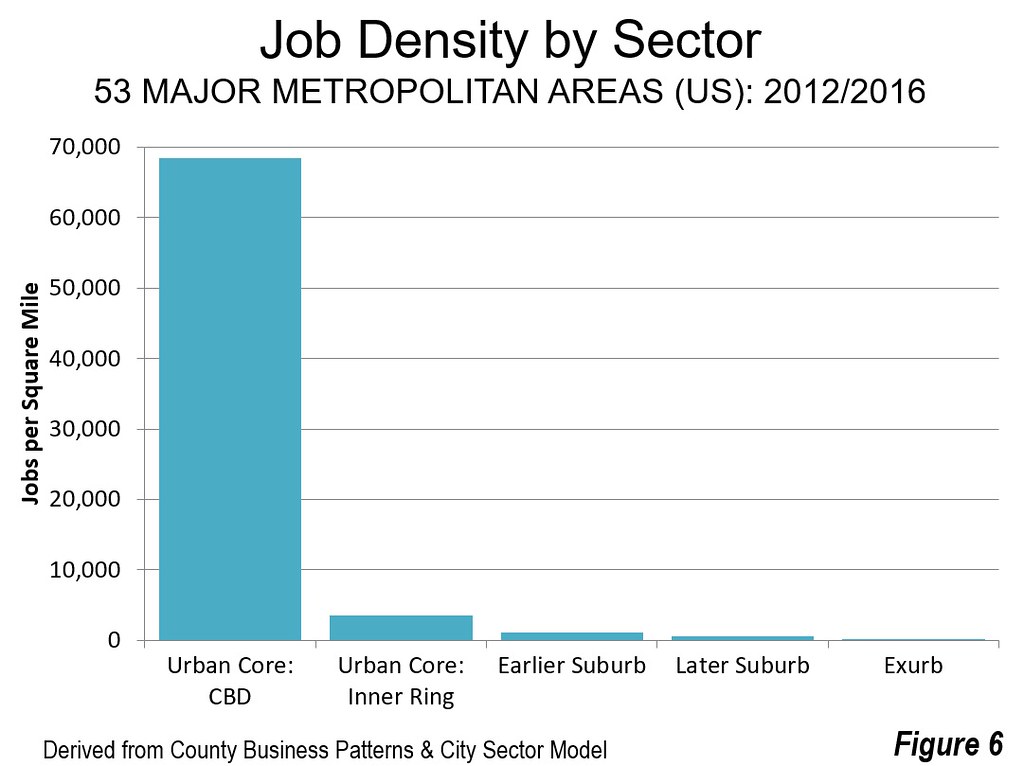
Jobs and resident workers are relatively balanced in US metropolitan areas. In the suburbs and exurbs, there are 0.95 jobs per resident worker, and 1.28 resident jobs per resident workers in the Urban Core (Figure 4). This figure, however, masks the distorted ratio in the Urban Core CBD, which has by far the highest employment density of any sector, nearly 20 times that of the second densest sector (Urban Core: Inner Ring) and 60 times that of the Earlier Suburbs, which have nearly five times as many jobs (Figure 6). Yet despite its extreme concentration of employment, the Urban Core: CBD still only represents less than 10 percent of overall employment.
Travel Times
This dispersion works to the advantage of commuters, whose travel times are remarkably similar throughout metropolitan areas.
Overall, suburban and exurban commuters have faster travel times (28.1 minutes) on average to work than those living (Figure 7) in the urban cores (32.7 minutes). The greatest disparities are in the largest metropolitan areas, such as in New York, Los Angeles, Chicago, and Philadelphia where urban core commuters travel for much longer to get to work, (Table). Nonetheless, in many other metropolitan areas, urban ore residents have quicker work trip travel time than those in the suburbs and exurbs. Overwhelmingly, these are where there is greater auto use (cars have quicker work trips, see below), together with low enough densities to limit traffic congestion.
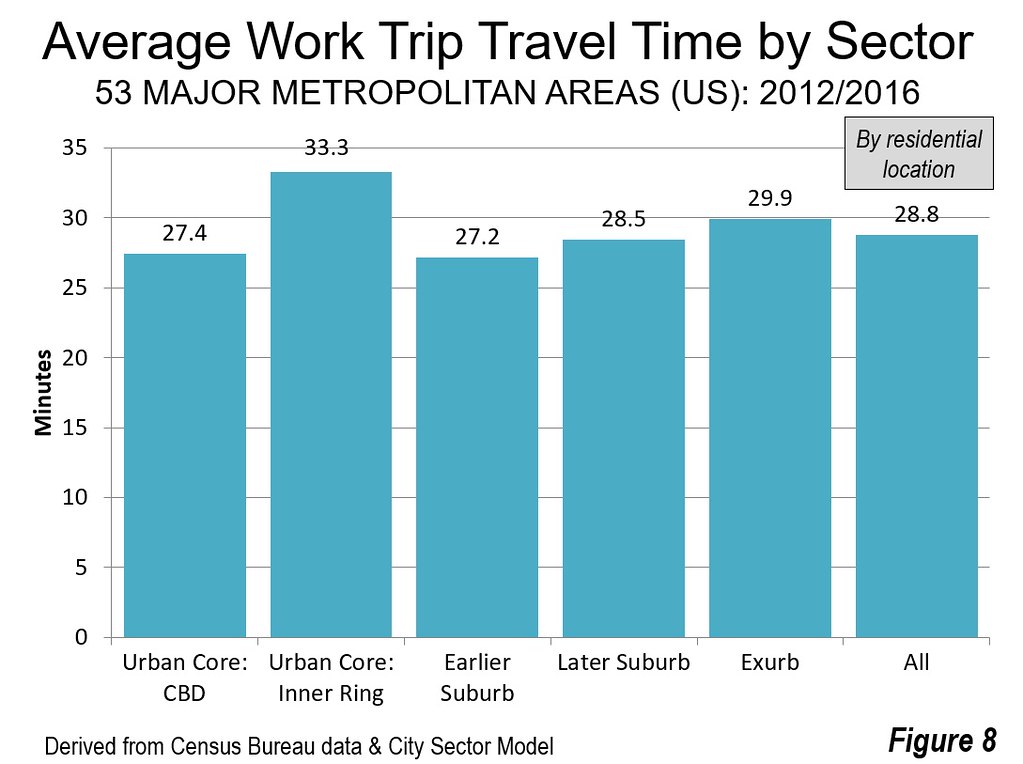
The finer grained sectoral analysis shows that workers living in the Earlier Suburbs have the shortest commutes, at 27.2 minutes. Those living in the Urban Core: CBD have the second shortest travel times, at 27.4 minutes (Figure 8). Neither of these results are surprising. The Earlier suburbs are more accessible to the rest of the city, since they are closer to the four other sectors and they have the most jobs. The shorter travel times of the Urban Core: CBD make the chances of finding suitable employment that can be reached more quickly, with six times as many jobs as workers. Obviously, this cannot be replicated throughout the metropolitan area, since by definition, labor markets have about the same number of jobs and employed workers.
The longest travel time among the five sectors is in the Urban Core: Inner Ring, at 33.3 minutes. The outer two sectors, the Later Suburbs and the Exurbs have travel times of 28.5 minutes and 29.9 minutes, close to the average of 28.8 minutes. This demonstrates the effectiveness of automobile oriented residential and employment density in keeping travel times down. It is worth noting that more dense international cities, that are the most dependent on transit, tend to suffer longer commuting times, such as Hong Kong and Tokyo.
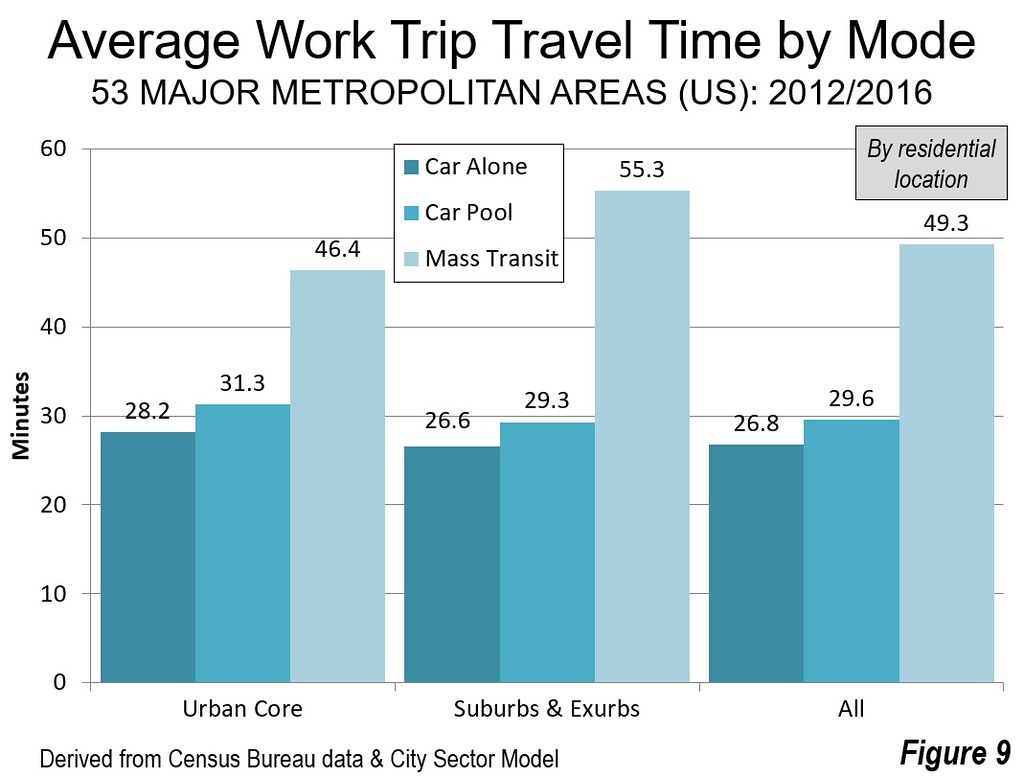
Among the largest commuting modes (excluding working at home with its commute time of zero), driving alone takes the least time, averaging 28.2 minutes for urban core residents and 26.6 minutes for suburban and exurban residents. In both cases, car pools travel about three minutes longer. Transit takes much longer, 46.4 minutes for urban core residents and 55.3 minutes for suburban and exurban residents (Figure 9). Among the five sectors, there is little difference in commuting times for those who drive along or are in car pools.
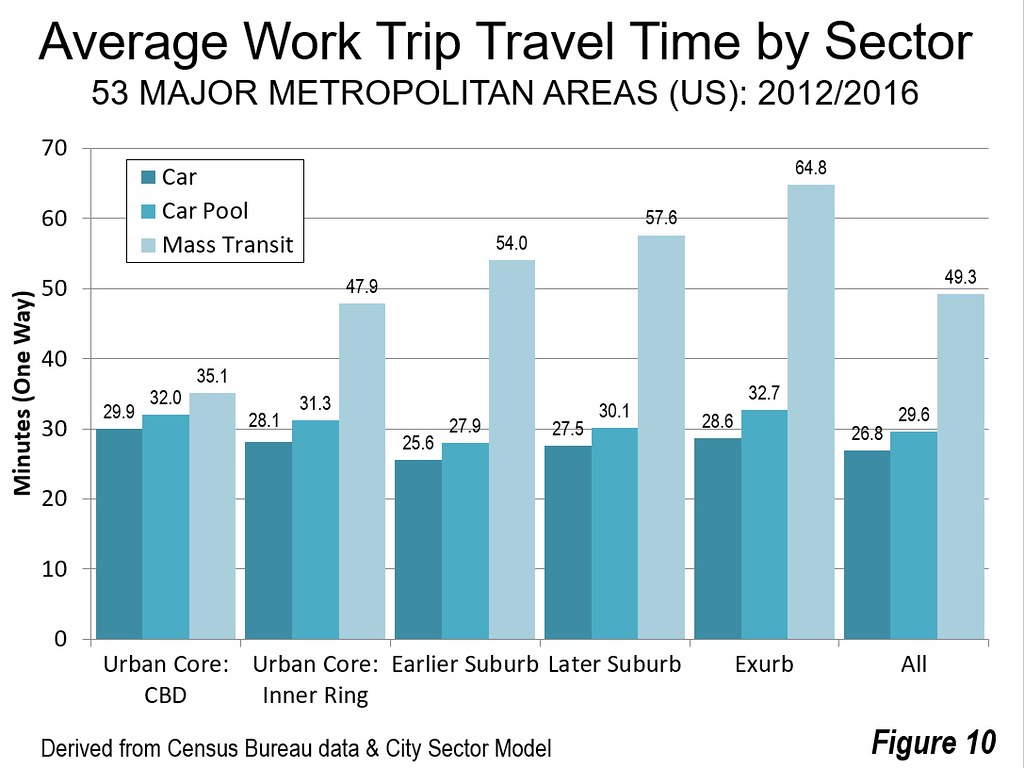
Transit travel times rise rapidly as distances increase from the CBD (Figure 10). This is to be expected, since transit systems are necessarily designed principally to serve the CBDs, where employment densities are high enough to justify frequent service, despite massive subsidies. Elsewhere in the metropolitan area, that is simply not the case, with automobiles providing access to more than 60 times as many jobs in 30 minutes as transit in the major metropolitan areas (see: “Focusing on Mobility, Not Travel Mode for Better Economic Growth”). With this kind of disparity, it is not hard to understand why automobiles dominate travel in the modern city.
Maintaining Quicker Travel Times
Yet, for decades, transit promoters have claimed that much more transit spending would reduce traffic congestion. This just has not happened. Perhaps the starkest example is Los Angeles County, which has seen driving and working at home capture 99 percent of the nearly 350,000 new daily commutes over the last decade (according to American Community Survey data), and an overall drop in transit commuting, despite a Herculean pace of new rail and busway openings. Yet, quick work trip travel times remain integral to improved economic performance. Continuing dedication and efforts to provide sufficient roadway capacity are needed to “keep the traffic moving”, perhaps with the aid of new technologies such as ride-hailing and, down the road, autonomous vehicles.
Note: The City Sector Model classifies small areas based upon their urban characteristics, with two urban core sectors (Urban Core: CBD and Urban Core: Inner Ring) having higher population densities, and greater dependence on transit, walking and cycling. The three other sectors, Earlier Suburbs, Later Suburbs and Exurbs are more automobile oriented and tend to have the suburban forms that have dominated development since World War II. City Sector Model analysis provides results that are far more accurate in measuring urban cores versus suburban and exurban development than using municipal boundaries, since the most of the core municipalities have the majority of their population in areas with suburban and exurban characteristics and none is 100 percent urban core. For example, even in the city of New York, much of Staten Island is at least as suburban as the adjacent New Jersey suburbs).
Photograph: Los Angeles Urban Area Freeway (densest large urban area in the United States), by author


| AVERAGE WORK TRIIP TRAVEL TIMES: 2016 | |||
| US Major Metropolitan Areas | |||
| Major Metropolitan Area | Urban Core | Suburbs & Exurbs | Entire MSA |
| Atlanta, GA | 21.8 | 31.0 | 31.0 |
| Austin, TX | 17.1 | 26.6 | 26.4 |
| Baltimore, MD | 29.8 | 30.6 | 30.5 |
| Birmingham, AL | 26.0 | 26.0 | |
| Boston, MA-NH | 29.8 | 31.1 | 30.6 |
| Buffalo, NY | 20.4 | 21.6 | 21.3 |
| Charlotte, NC-SC | 26.3 | 26.3 | |
| Chicago, IL-IN-WI | 33.5 | 30.6 | 31.3 |
| Cincinnati, OH-KY-IN | 20.9 | 25.0 | 24.6 |
| Cleveland, OH | 24.0 | 24.8 | 24.6 |
| Columbus, OH | 19.0 | 23.7 | 23.5 |
| Dallas-Fort Worth, TX | 23.1 | 27.8 | 27.8 |
| Denver, CO | 22.9 | 27.5 | 27.3 |
| Detroit, MI | 26.4 | 26.7 | 26.7 |
| Grand Rapids, MI | 19.9 | 22.0 | 21.9 |
| Hartford, CT | 22.1 | 24.0 | 23.8 |
| Houston, TX | 19.9 | 29.5 | 29.4 |
| Indianapolis. IN | 22.6 | 24.9 | 24.8 |
| Jacksonville, FL | 26.3 | 26.3 | |
| Kansas City, MO-KS | 19.9 | 23.1 | 22.9 |
| Las Vegas, NV | 26.3 | 24.3 | 24.4 |
| Los Angeles, CA | 31.0 | 29.5 | 29.6 |
| Louisville, KY-IN | 21.6 | 23.9 | 23.7 |
| Memphis, TN-MS-AR | 19.5 | 24.1 | 24.0 |
| Miami, FL | 26.6 | 28.6 | 28.5 |
| Milwaukee,WI | 21.9 | 23.5 | 23.2 |
| Minneapolis-St. Paul, MN-WI | 22.5 | 25.6 | 25.2 |
| Nashville, TN | 14.6 | 27.1 | 27.1 |
| New Orleans. LA | 20.5 | 26.4 | 25.7 |
| New York, NY-NJ-PA | 38.9 | 32.6 | 35.9 |
| Oklahoma City, OK | 16.4 | 22.6 | 22.4 |
| Orlando, FL | 27.9 | 27.9 | |
| Philadelphia, PA-NJ-DE-MD | 32.2 | 28.3 | 29.2 |
| Phoenix, AZ | 26.0 | 26.0 | |
| Pittsburgh, PA | 24.7 | 26.9 | 26.5 |
| Portland, OR-WA | 24.0 | 26.4 | 26.1 |
| Providence, RI-MA | 23.4 | 26.3 | 25.6 |
| Raleigh, NC | 25.3 | 25.3 | |
| Richmond, VA | 19.2 | 25.4 | 25.1 |
| Riverside-San Bernardino, CA | 31.8 | 31.8 | |
| Rochester, NY | 19.7 | 21.4 | 21.2 |
| Sacramento, CA | 21.8 | 26.4 | 26.3 |
| St. Louis,, MO-IL | 23.1 | 25.8 | 25.5 |
| Salt Lake City, UT | 18.8 | 22.7 | 22.5 |
| San Antonio, TX | 17.1 | 25.7 | 25.6 |
| San Diego, CA | 22.3 | 25.4 | 25.3 |
| San Francisco-Oakland, CA | 31.7 | 32.4 | 32.2 |
| San Jose, CA | 21.1 | 27.3 | 27.3 |
| Seattle, WA | 25.4 | 30.2 | 29.6 |
| Tampa-St. Petersburg, FL | 26.7 | 26.7 | |
| Tucson, AZ | 24.3 | 24.3 | |
| Virginia Beach-Norfolk, VA-NC | 18.9 | 24.2 | 24.1 |
| Washington, DC-VA-MD-WV | 30.6 | 35.3 | 34.4 |
| TOTAL | 32.7 | 28.1 | 28.8 |
| Derived from American Community Survey, 2016. | |||
Wendell Cox is principal of Demographia, an international public policy and demographics firm. He is a Senior Fellow of the Center for Opportunity Urbanism (US), Senior Fellow for Housing Affordability and Municipal Policy for the Frontier Centre for Public Policy (Canada), and a member of the Board of Advisors of the Center for Demographics and Policy at Chapman University (California). He is co-author of the "Demographia International Housing Affordability Survey" and author of "Demographia World Urban Areas" and "War on the Dream: How Anti-Sprawl Policy Threatens the Quality of Life." He was appointed to three terms on the Los Angeles County Transportation Commission, where he served with the leading city and county leadership as the only non-elected member. He served as a visiting professor at the Conservatoire National des Arts et Metiers, a national university in Paris.
Wednesday, October 24, 2018
Todd Bol, Creator of Little Free Library Movement, Dies at 62
Todd Bol, Creator of Little Free Library Movement, Dies at 62
I Todd Bol, the creator of Little Free Libraries, in 2013 with Eddye Watkins, who hosted an Amish-made box in her yard in Minneapolis. Mr. Bol considered libraries to be part of the connective tissue of communities.CreditCreditDavid Joles/Star Tribune, via Associated Press
By Katharine Q. Seelye
Oct. 23, 2018
The idea was born of a home renovation and evolved into a worldwide movement.
In 2009, Todd Bol was renovating his garage in Wisconsin when he ripped off its old wooden door. He liked the wood, though, and didn’t want to throw it out. So after staring at it for a while, he decided to use it to build a small monument to his mother, who had been a schoolteacher.
He fashioned it into a replica of a schoolhouse, two feet high and two feet wide, put his mother’s books in it, and planted it on his front yard, hoping to start a little book exchange for his neighbors.
“It was a spiritual gesture,” he said.
That gesture spawned what might be called the tiny library movement, leading to his founding of a nonprofit organization called Little Free Library a year later.
Since then more than 75,000 Little Free Library boxes, which blend the form of folk art with the function of a community water cooler, have popped up in all 50 states and in 88 countries.
They operate under the honor system: You take a book and sometimes you leave a book, so the content of the boxes is constantly changing.
Mr. Bol, who considered libraries to be part of the connective tissue of communities, where everyone was welcome and reading could be encouraged, died on Thursday in hospice care in Oakdale, Minn. He was 62. The cause was complications of pancreatic cancer, his brother Tony said.
Today, the little book-sharing boxes can be found on urban street corners and at suburban malls, in cornfields, forests and lake sides, in subway stations in New York City, police precinct buildings in Los Angeles and a refugee settlement in Uganda. The Today Show established one at NBC’s headquarters at 30 Rockefeller Plaza in Manhattan.
Image
 Mr. Bol in 2012 in Hudson, Wis. His mini-libraries — part folk art, part community water cooler — spread like a prairie fire.CreditJim Mone/Associated Press
There is even a Little Free Library on the Yamal Peninsula in Siberia, for reindeer herders and their families.
Each box contains at least 20 volumes, curated by local “stewards,” the people who put up the boxes in the first place and use their own taste and discretion to cull the collections.
Mr. Bol was inspired by Andrew Carnegie, the steel and railroad magnate who at one point was the world’s richest man and who left a legacy of libraries around the world. The once-poor Mr. Carnegie believed that “the man who dies rich dies in disgrace,” and saw building libraries as a way for him to give back to society and help people help themselves. By the early 1900s, he had established 2,509 of them.
Mr. Bol wanted to surpass Mr. Carnegie’s feat. He set his sights on building 2,510 little libraries. It took only two years.
“I thought it was just a flash in the pan, like a pet rock,” his brother Tony said in a telephone interview. Todd Bol never sent out a news release to publicize his project, and yet small local papers and then the national media began noticing the phenomenon and writing about it.
“What was powerful about it was that all you needed was the idea,” Tony Bol said. “It didn’t have 17 steps. You just build it, or order it, then put it up in your yard, like a public art monument.”
Todd Herbert Bol was born on Jan. 2, 1956, in St. Paul. to Richard and June (Pattridge) Bol. His father was a chiropractor, and his schoolteacher mother was a booklover who also tutored children at her kitchen table.
In addition to his brother Tony, he is survived by his wife, Susan Marie (Hanson) Bol; a daughter, Allison; a son, Austin; two brothers, Rick and Scot; and a sister, Carolee.
Mr. Bol was raised in Lake Elmo, Minn. He graduated from the University of Wisconsin-River Falls in 1979 with a degree in sociology and in 1982 received a second bachelor’s degree, in psychology. He was a public-school teacher for a time before he went into business arranging fellowships for nurses from overseas to come to the United States.
After he built the schoolhouse library box in honor of his mother, things were quiet. But the next year, in 2010, when he was having a garage sale at his home, in Hudson, Wis., his neighbors came by and were immediately captivated by his Little Free Library.
“I put up my library and noticed my neighbors talking to it like it was a little puppy,” Mr. Bol told The Washington Post in 2013. “And I realized there was some kind of magic about it.”
As orders started to come in, Mr. Bol built many of the little libraries himself, with the assistance of Henry Miller, an Amish craftsman. Little Free Library, the nonprofit organization, made several designs available on its website, littlefreelibrary.org, and offered specifications for do-it-yourselfers.
They spread like a prairie fire. Mr. Bol took 25 little boxes made by prisoners to Detroit, and, thanks to a “super steward” there, Detroit soon had more than 400, according to Tony Bol.
The little libraries come in all shapes — as boxcars, birdfeeders and barns; spaceships, robots and roosters; Victorian mansions, log cabins and even the replicas of the houses they stand in front of. Someone in California made one in the shape of an old Volkswagen van with a surfboard on top.
Perhaps surprisingly, vandalism has not been a problem, but there have been exceptions. One Little Free Library in Indianapolis was destroyed by arson this month. But residents have rallied around, and plans are afoot to build 100 Little Free Libraries in its place.
“Todd created this beautiful, living, breathing movement of literacy and community that resonated from that very first Little Free Library all the way to today,” Margret Aldrich, a spokeswoman for Little Free Library and author of “The Little Free Library Book” (2015), said in an interview.
“He was a true believer in the power of one person to make a difference,” she said. “And he certainly did.”
Editor's Note: We need more "Little Free Libraries" in Marinwood. Do you want to adopt one? Email savemarinwood@gmail.com for details.
Editorial: Dixie board should lead name-change decision
 |
| Can we listen to each other? |
Editorial: Dixie board should lead name-change decision
By MARIN IJ EDITORIAL BOARD |
October 24, 2018 at 10:00 am
Over the years the names of Marin public schools and their districts have changed a lot. Most of the changes were the result of changing times, most often the consolidation of smaller districts.
For many years, the Clark School District served children in West Marin, until it merged with the Tomales School District is 1943. Today, the area it drew children from is served by the Shoreline Unified School District.
Same for the Garcia, Shafter, Pierce and Halleck (named for Union general Henry Halleck) school districts that governed public schools in West Marin. All were named for Marin pioneers, some of whom are remembered by other landmarks such as a bridge, ranch or prominent spot on the map.
The Eastland School District was formed in Mill Valley in 1892 and was merged with the Mill Valley School District.
In 1913, the Ross Landing School District changed its name to the Kentfield School District.
Today, most of the names of Marin school districts reflect their geographic location.
A long-standing anomaly is the Dixie School District, started in 1864 in the schoolhouse built by pioneer rancher James Miller.
Although Marin was a Union hotbed during the Civil War, according to the Old Dixie Schoolhouse web page, the district got its name on a dare from Southern sympathizers who had helped build the schoolhouse that Miller came to name “Dixie.” See the full article HERE
Editor's Note:
Why not commit to a year of community discussion with the goal of understanding both sides of the debate?
I doubt we will have any more "proof" than we have today.
There are essentially two versions of how Dixie got its name. 1.) It was named on a dare in 1863 during the Civil War as an act of mischief because Miller, the person who built Dixie School house had friends from the South who helped it build it. Miller was a prosperous Irish immigrant who lived for a short time in Missouri, a confederate state but had emigrated to Marin County in 1849 before the Civil War. 2.) Miller named his school for Mary Dixie, a Miwok woman from Vallecito, who he had met during his travels. There was never intent to immortalize the Confederacy.
Whatever his intent, Miller created a vital social institution that helped educate thousands of children in the subsequent years which became the Dixie School district which the community is justifiably proud. No one that I know in the "We are Dixie" makes the link today with the Confederacy any more than they think of "Las Gallinas" is about "the chickens". It is just a word and the suggestion that it represents intolerance, racism or white supremacy is a smear on our community. The "Change the Name" people believe that ignoring the issue demonstrates that the community is petty and intolerant today. Changing the name will signal that we have grown more tolerant and inclusive. It is more than an exercise in political correctness. It is a statement of community.
Can both positions be true? I don't think it is worth trying to "prove" that which cannot be proven. Both stories are based on second hand accounts. No corroborative evidence exists. Nevertheless, the insults volleyed from both sides ARE a problem. Let's listen to each other and decide how we embrace our future.
For me, the issue is naming the school "Dixie" in 1863 during the worst moments in our nations history when thousands died over the war of slavery. I don't need to know the "reason" or the "true story". It doesn't make a difference to me. The name of our school district should reflect the future we want to embrace.
Can we listen to each other with compassion? I think it is possible.
Tuesday, October 23, 2018
Remedies and Penalties for Violating The Public Contract Code. (ATTN MARINWOOD CSD)
2009 California Public Contract Code - Section 10420-10426 :: Article 9. Remedies And Penalties
PUBLIC CONTRACT CODESECTION 10420-10426
10420.  Every contract or other transaction entered in violation of
any provision of this chapter is void, unless the violation is
technical or nonsubstantive.

10421.  The state, or any person acting on behalf of the state, may
bring a civil action seeking a determination by the Superior Court
that a contract or other transaction has been entered in violation of
any provision of this chapter. If the court finds substantial
evidence of such a violation, it may issue a temporary injunction to
prevent any further dealings upon the contract or other transaction,
pending a final determination on the merits of the case. If the
action results in a final determination that the contract or other
transaction has been entered in violation of this chapter, it shall
be void, and the state or person bringing the action shall be awarded
costs and attorney's fees. This section shall not be construed to
permit an award of costs and attorney fees to the person or entity
contracting or otherwise transacting with the state.

10422.  Any officer or employee of the department who corruptly
performs any official act under this chapter to the injury of the
state is guilty of a felony.

10423.  Any person contracting with the state by oral or written
contract who corruptly permits the violation of any contract made
under this chapter is guilty of a felony.

10424.  Persons convicted under Section 10422 or 10423 are also
liable to the state for double the amount the state may have lost, or
be liable to lose by reason of the acts made crimes by this article.

10425.  Willful violation of any other provision of this chapter
shall constitute a misdemeanor.

10426.  (a) It shall be unlawful for a person to intentionally
disclose proprietary information obtained in the negotiation,
execution, or performance of a consulting services contract, as
defined in Section 10335.5, or an information technology contract, as
defined in Section 11702 of the Government Code, with a state agency
when the contracting party knew or should have known that the
disclosure was likely to cause harm.
   (b) A violation of this section shall be punishable as a
misdemeanor and may be prosecuted by the Attorney General or by a
local district attorney in the district in which the disclosure took
place.
   (c) (1) For the purposes of this section "proprietary information"
shall include any information agreed by the contracting parties to
be proprietary or any information that is designated by a contracting
state agency to be proprietary. A contracting state agency shall
specifically identify in the contract any information that is
considered to be proprietary. The state agency shall make this
designation only in cases where the state agency has reason to
believe that the release of this information poses an immediate
threat to the health, safety, or welfare of the public or the state
agency has reason to believe that the contracting party intends to
sell the information. If the state agency makes a designation of
proprietary information subsequent to the execution of the contract,
the state agency shall make a good faith effort to amend the contract
to incorporate the subsequent designation of proprietary
information. A contracting state agency shall provide written
notification to a contracting party of any information that,
subsequent to the execution of the contract, is identified to be
proprietary. A contracting party is not in violation of this section
if that party discloses information prior to the receipt of the
written notification.
   (2) Any information that is required to be released or disclosed
by a contracting party pursuant to a legal requirement, including an
order of a court or regulatory agency, shall not be considered a
violation of this section.
PENALTIES FOR VIOLATIONS OF STATE ETHICS AND PUBLIC CORRUPTION LAWS
10/22/2018
Legislators, public employees, and other public servants may face severe consequences for violating the public trust.
The range of penalties includes censure, removal from office, permanent disqualification from holding any state position, restitution, decades in prison, and fines up into the hundreds of thousands of dollars.
Not all ethics violations are treated equally. Punishments correspond to how bad an instance of misconduct is viewed in the eyes of a state with consideration of the harm a violation may cause. The most severe consequences are normally reserved for cases of bribery involving large sums or similar types of violations. Like most issues in ethics, however, states vary widely on the details.
The criminal justice process works separately from commissions and committees to impose punishments for wrongdoing. Each may discipline violators of ethics laws using criminal or administrative penalties, respectively, independently and concurrently, depending on the law violated.
The following table details the variety of consequences that correspond to different types of ethical violations, with the emphasis on statutory provisions. Administrative rules and chamber rules, which public officials and employees may also be bound by, are not included in this table. For example, a state's statutes may not require that a legislator be removed from office for engaging in nepotism, but the offender may still be removed from office if provided for by some other policy or procedure not covered here. Provisions may also subject to judicial interpretation and common law principals not included here.
Subscribe to:
Posts (Atom)