Pervasive Suburbanization: The 2017 Data
in Housing, Suburbs, Uncategorized /by Wendell Cox
The most recent Census Bureau population estimates have made it clear that migration to the suburbs and away from urban cores has accelerated dramatically since the early years of the Great Recession (see here and here). More detailed national data, from the Current Population Survey (CPS) indicates that moving to the suburbs is pervasive (CPS is a joint program of the Census Bureau and the Bureau of Labor Statistics). The CPS data is much higher level geographically than similar data Census Bureau and Internal Revenue Service migration, providing no state, county or metropolitan area breakdowns. CPS data is national, and divided further into the 4 regions (Northeast, Midwest, South and West) and nine divisions (New England, Mid-Atlantic, East North Central, West North Central, South Atlantic, East South Central, West South Central, Mountain and Pacific).
Domestic Migration: Plus 2.3 Million to Suburbs, Minus 2.3 Million from “Principal Cities”
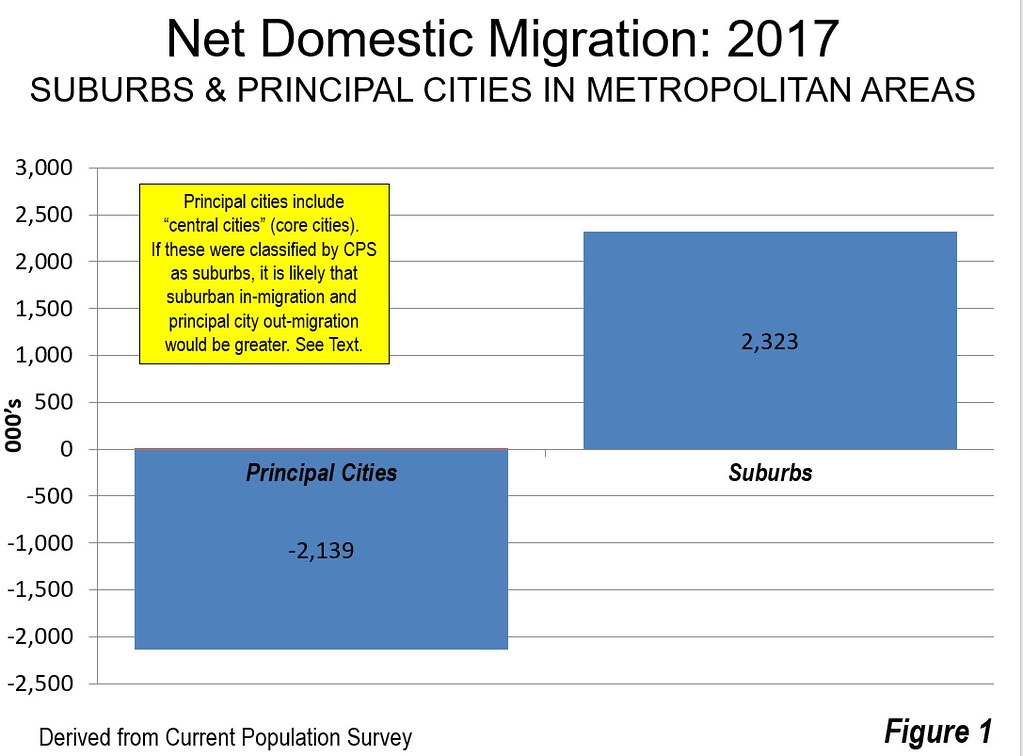
Between 2016 and 2017, more than 2.3 million (net) US residents moved into what the CPS classifies as. “suburbs.” At the same time, 2.3 million (net) moved away from “principal cities,” with most of their population in those classified as “central cities” (urban core cities) before 2003 (Figure 1). In fact this approach probably under-estimates the extent of migration into suburbs and out of the urban cores of metropolitan areas. This is because many principal cities are, in fact suburbs whose high employment levels, not their overwhelmingly suburban and automobile oriented urban form, determines their classification. For example, suburban principal cities, such as Plano, Texas, Mesa, Arizona, Bellevue, Washington, Sandy Springs, Georgia, and many others are likely to be not losing domestic migrants, while the suburbs with smaller employment bases around them are gaining. Indeed, many non-historical core principal cities did not even exist when the great post-World War II automobile -oriented suburbanization started and were some were primarily rural into the 1960s.
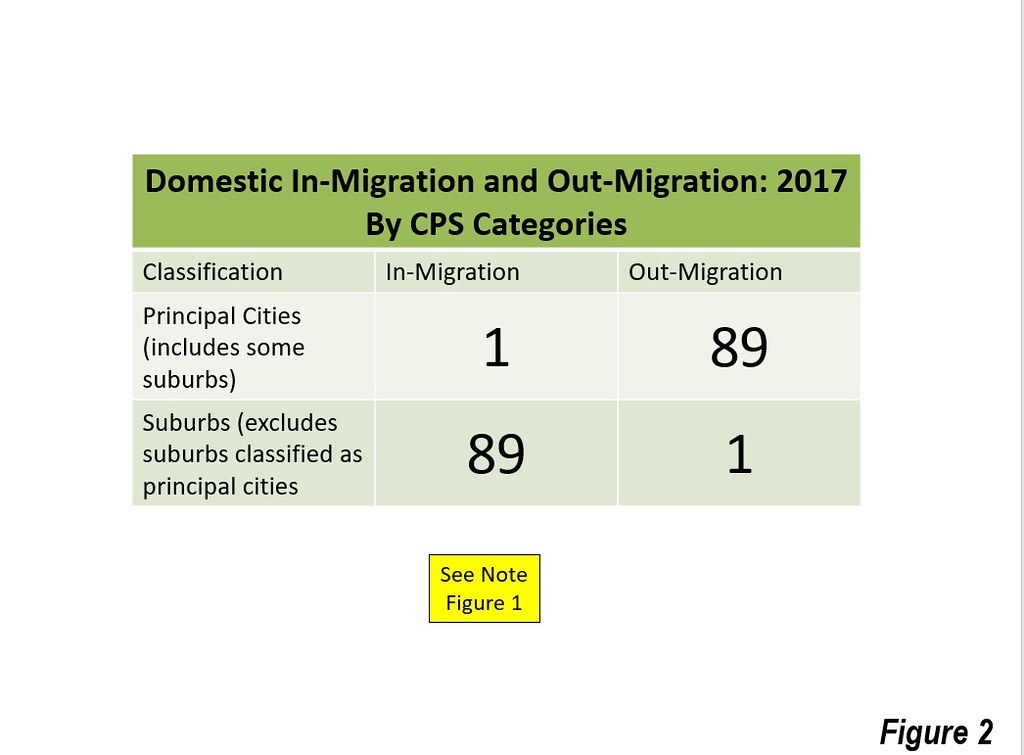
The move to the suburbs was so pervasive that CPS found gains in 89 of 90 categories. The principal cities, on the other hand lost in 89 of 90 categories (Figure 2), which are organized into total, sex, age, race and Hispanic origin, relationship to householder (formerly called “head of household), educational attainment, marital status, nativity, tenure, poverty status, income, labor force status, major occupation and major industry.
This article summarizes some of the most important findings from the latest CPS data.
Millennials: Moving to the Suburbs
One of the most enduring urban myths has been that millennials are rejecting the suburbs for the inner cities. We have previously shown that the largest percentage of millennial growth is in the suburbs not the urban core. According to CPS, those aged 20 to 29 are net moving in large numbers away from the principal cities, even including some largely suburban cities, (minus 329,000) and to the suburbs (plus 383,000)
All Other Ages: Moving to the Suburbs
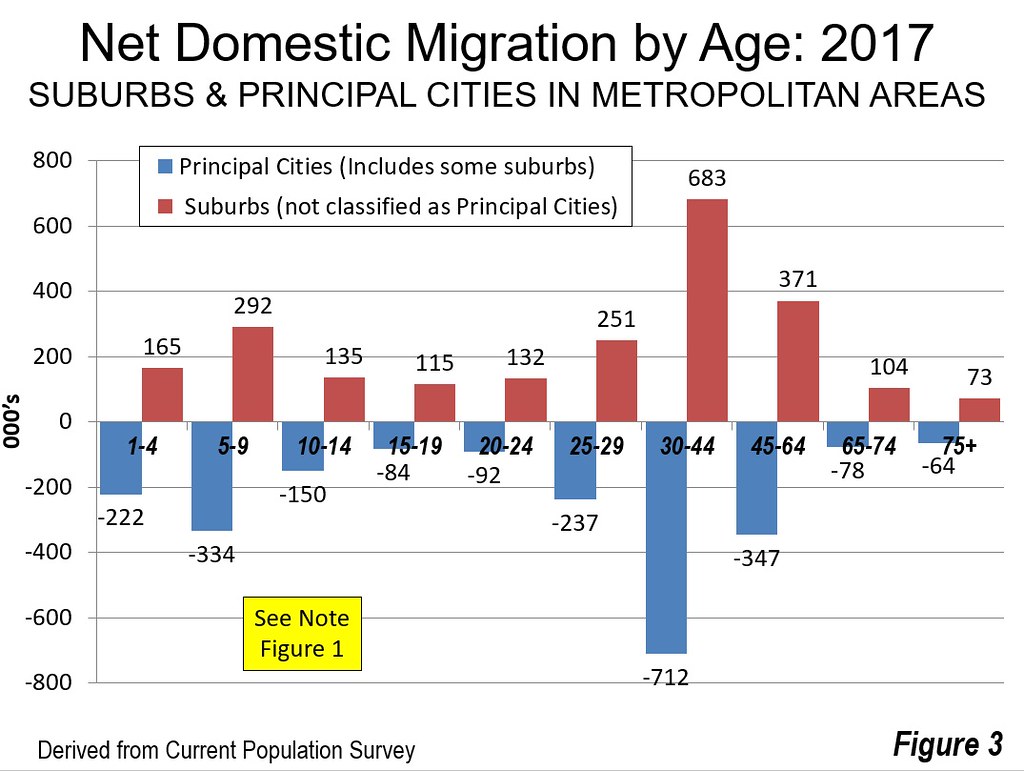
Millennials are not alone. It is well known that the more family friendly characteristics of the suburbs attract people with young children. This is obvious by the 165,000 children aged 1 to 4 who are moved to the suburbs by their parents, compared to the 222,000 who are moved away from the principal cities (the balance of 57,000 were moved to non-metropolitan areas).
An even bigger gap is noted among children aged 5 to 9, 292,000 of whom were moved to the suburbs compared to the 334,000 moved away from the principal cities (and the 42,000 moved to non-metropolitan areas). This is consistent with the perception that core cities generally have inferior public schools, inducing parents to move to the suburbs or beyond when it comes time to enroll their children in schools.
The largest suburban advantage occurs in the 30 to 44 age category, when households are often starting families. Suburbs attract an astounding 683,000 domestic migrants in this category, while the principal cities lose 712,000. The suburban gains continue, but at a lower rate, as people reach 45 to 64 years of age. Suburbs gained 371,000 net domestic migrants, while principal cites lost 347,000.
The often suggested view that retirees are flocking to the inner cities is countered by the reality that in 2017, 104,000 aged 65 to 74 moved to the suburbs, while 78,000 moved away from the principal cities. The numbers moving are small since older people are increasingly aging in place, which for most is in the suburbs.
In every age category, then, the suburbs gain net domestic migrants, while the principal cities lose (Figure 3).
Minorities: Moving to the Suburbs
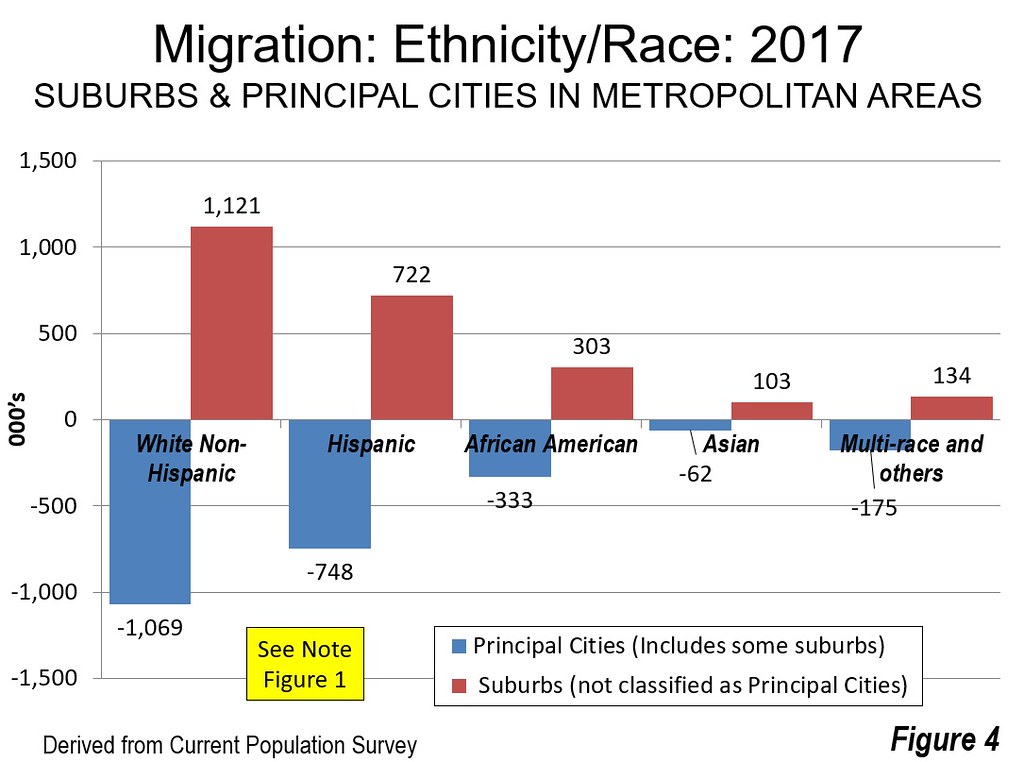
Perhaps the most important trends relate to ethnicity and race. The early post-World War II suburban migration might be characterized as “white flight,” but in recent decades minorities have been migrating to the suburbs. It is no surprise that White Non-Hispanics migrated strongly to the suburbs (plus 1,121,000) and away from the principal cities (minus 1,069,000). But Hispanics migrated even more strongly to the suburbs (plus 722,000) and away from the principal cities (minus 748,000). Similarly, African-Americans migrated to the suburbs (303,000) and away from the principal cities (minus 333,000). Asians, though a much smaller share of the population, also chose the suburbs overwhelmingly (plus 103,000) and abandoned the principal cities (minus 62,000).
Overall, among those who are minority or mixed race, 1.3 million moved to the suburbs, while 1.3 million moved away from the principal cities (Figure 4).
All Levels of Educational Attainment: Moving to the Suburbs
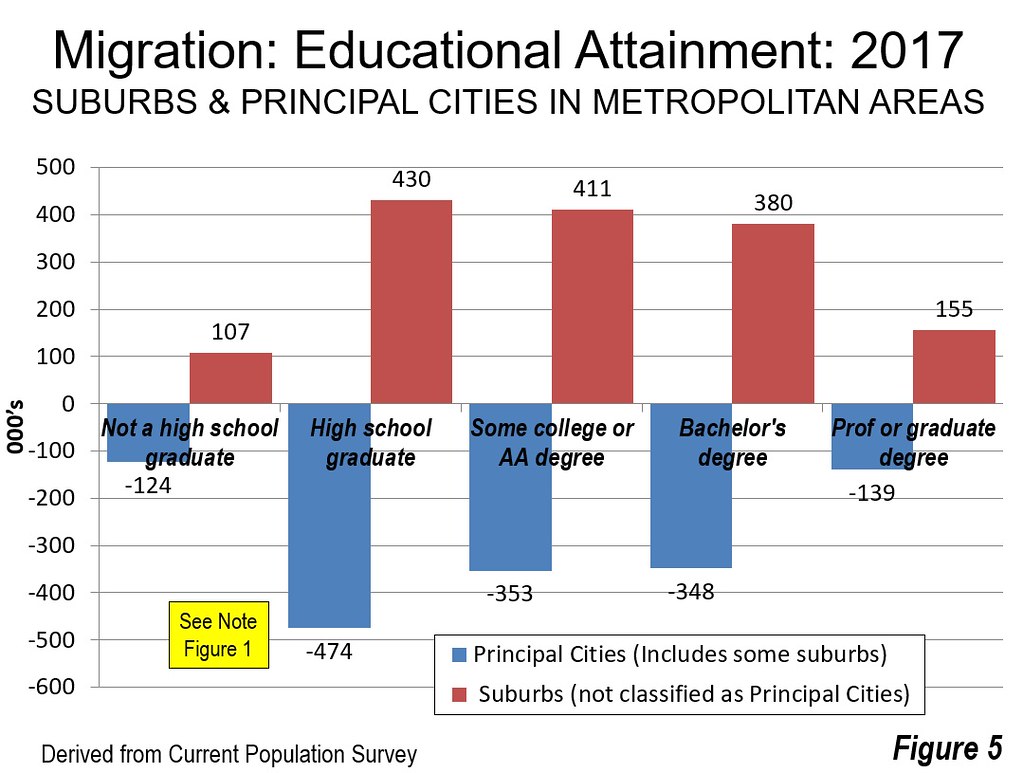
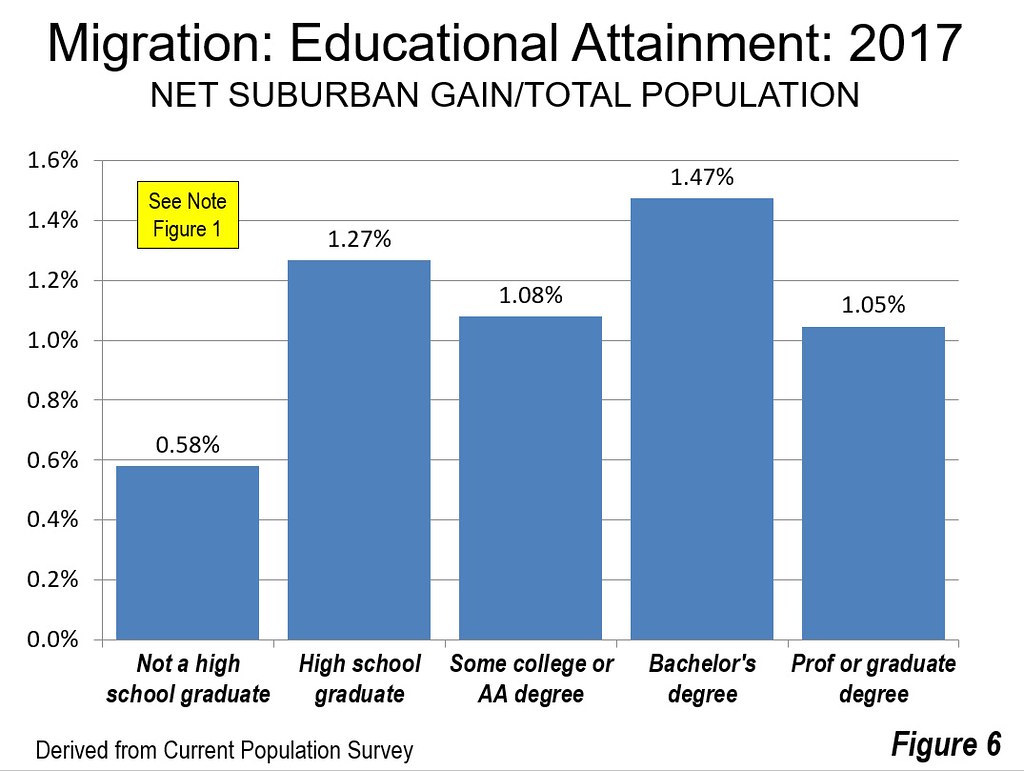
Regardless of educational attainment, net domestic migration is positive to the suburbs and negative to the principal cities (Figure 5). In relation to the total population of the educational attainment categories, the largest suburban over principal city gain was among those with bachelor’s degrees, while the smallest was among those without high school educations (Figure 6).
All Income Levels: Moving to the Suburbs
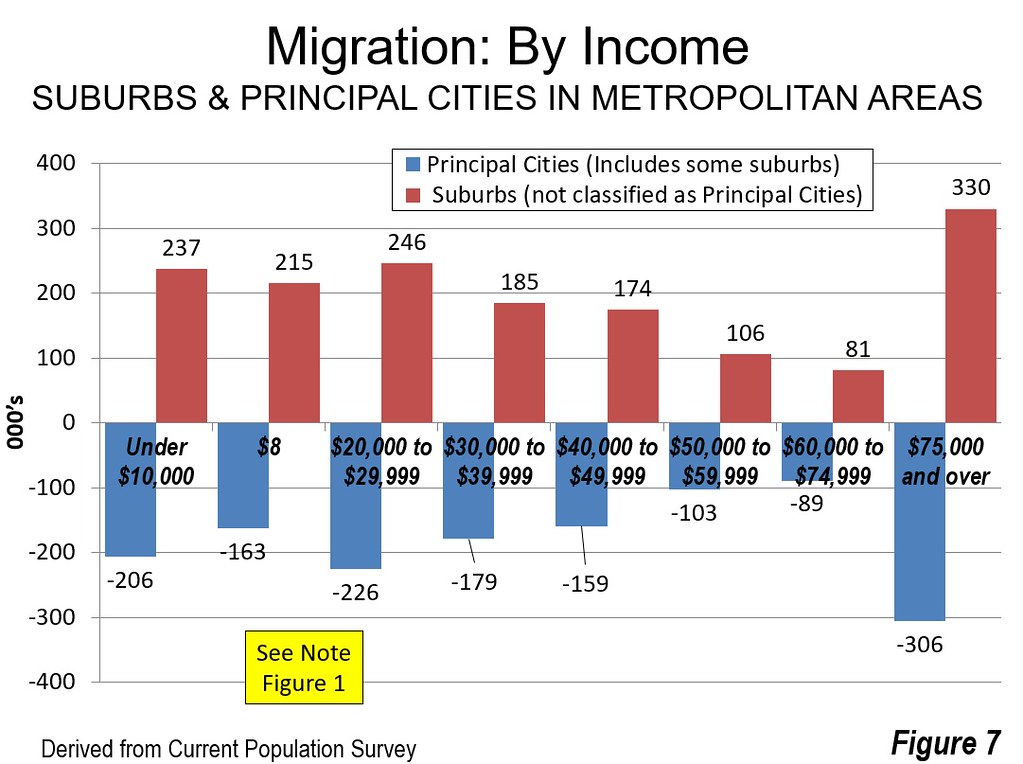
People of all income levels are moving to the suburbs. The highest income category shows the most significant movement into the suburbs and away from the principal cities (Figure 7)
Regardless of Poverty Status: Moving to the Suburbs
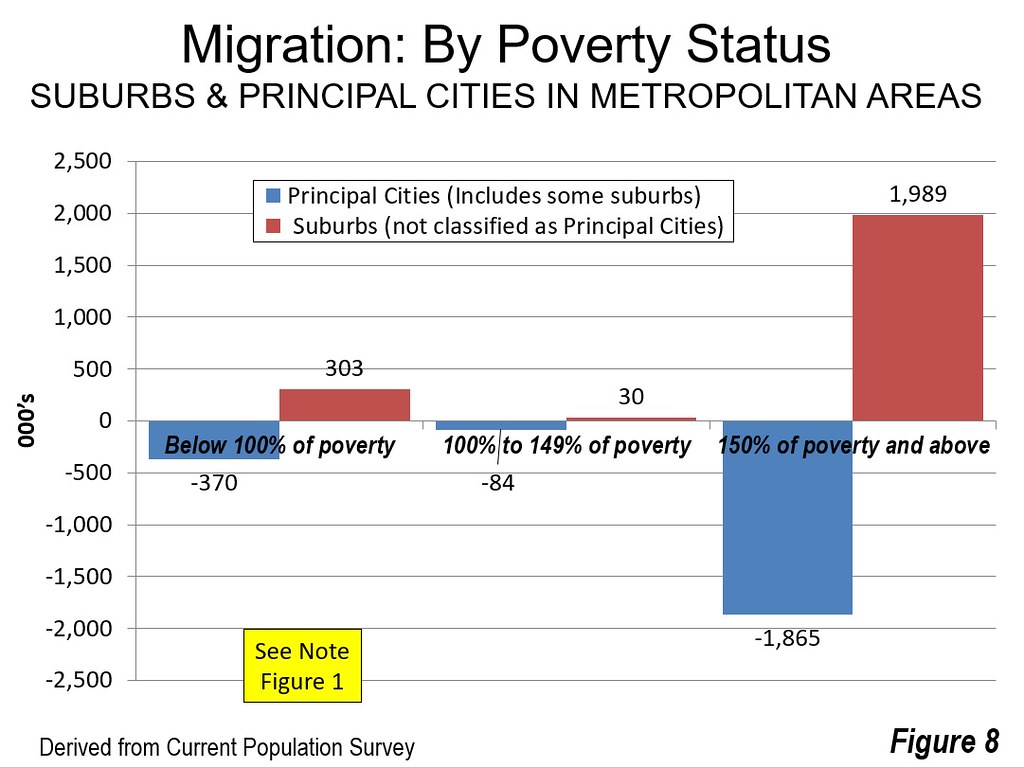
Both people above and below the poverty line exhibited strong net domestic migration to the suburbs and away from the principal cities. Approximately 85 percent of domestic migrants to the suburbs were above the poverty line (Figure 8). Our last review of central city versus suburban poverty showed that urban core poverty rates were double those of the suburbs.
Native Born and Foreign Born: Moving to the Suburbs
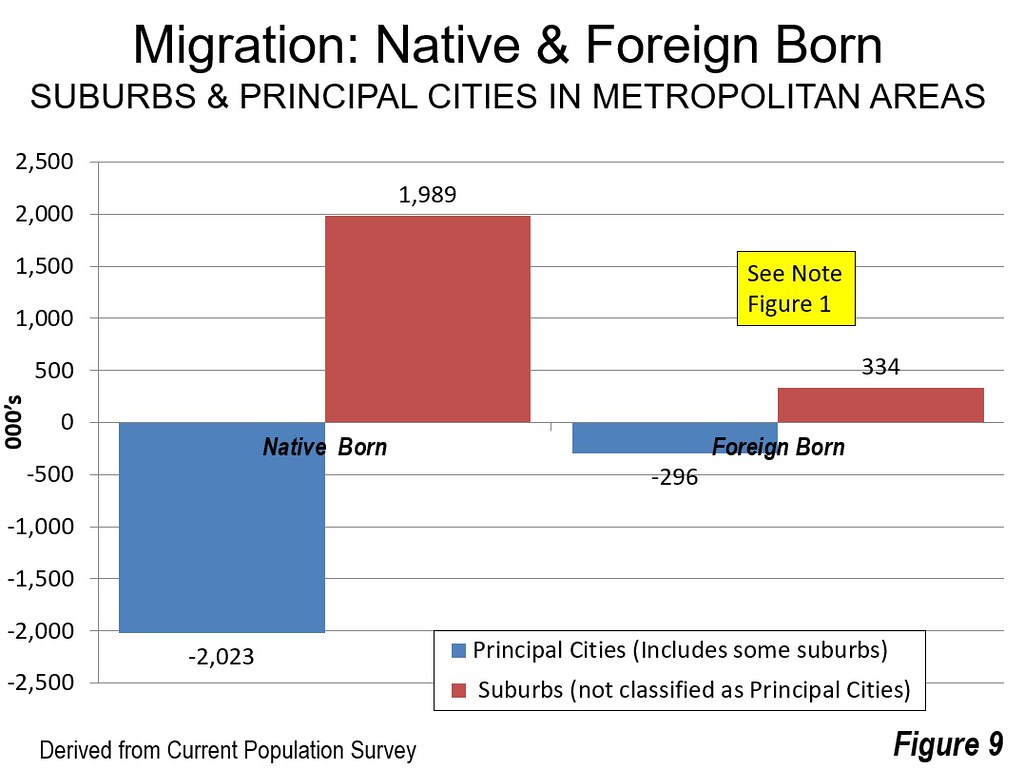
Both the native born and foreign born population exhibited strong net domestic migration to the suburbs and away from the principal cities (Figure 9).
Why People Continue to Move to the Suburbs
CPS summarizes reasons for moving, indicating that 43.0 percent of moves are housing related, 27.9 are family related, and 18.5 percent are employment related. Other reasons account for 10.6 percent. Housing related reasons would include moving to larger houses with yards, especially for their children. Family reasons would include households moving to school districts perceived likely to provide better educations to their children. Finally, employment reasons doubtless includes many households that move to be closer to jobs. All of these reasons favor the suburbs, where the houses are bigger and more spacious, where schools are perceived to be better and where 80 percent of the jobs are located.
Wendell Cox is principal of Demographia, an international public policy and demographics firm. He is a Senior Fellow of the Center for Opportunity Urbanism (US), Senior Fellow for Housing Affordability and Municipal Policy for the Frontier Centre for Public Policy (Canada), and a member of the Board of Advisors of the Center for Demographics and Policy at Chapman University (California). He is co-author of the “Demographia International Housing Affordability Survey” and author of “Demographia World Urban Areas” and “War on the Dream: How Anti-Sprawl Policy Threatens the Quality of Life.” He was appointed to three terms on the Los Angeles County Transportation Commission, where he served with the leading city and county leadership as the only non-elected member. He served as a visiting professor at the Conservatoire National des Arts et Metiers, a national university in Paris.

No comments:
Post a Comment