A blog about Marinwood-Lucas Valley and the Marin Housing Element, politics, economics and social policy. The MOST DANGEROUS BLOG in Marinwood-Lucas Valley.
Tuesday, September 1, 2015
Mapping Gentrification and Displacement in San Francisco
The San Francisco Bay Area is notoriously expensive to live in. Whether you blame Silicon Valley, regional transit investment, gentrification, or housing policy follies, the reality is that low- and middle-income families are being priced out of neighborhoods they used to call home. San Francisco’s Mission District is well-known example; here’s how The New York Times recently described the fraught transformation of a middle-class Latino part of that neighborhood:
The local color is still here: Splashy murals, many with political themes, provide open-air art on numerous buildings. But the housing prices have risen well beyond the reach of the average artist: Studio apartments in the Mission are listed on Zillow, the real estate site, for $2,700 a month, and one-bedrooms for $3,800. When a family in a rent-controlled apartment leaves or is forced out, the rent is jacked up to market rate, apartments become condominiums or are advertised by the landlord on Airbnb as a good place for short-term visits.
To better understand the complex forces at play in the Mission District and other neighborhoods losing residents, UC-Berkeley and UCLA researchers developed the Urban Displacement Project, which maps the change of urban demographics in the region.
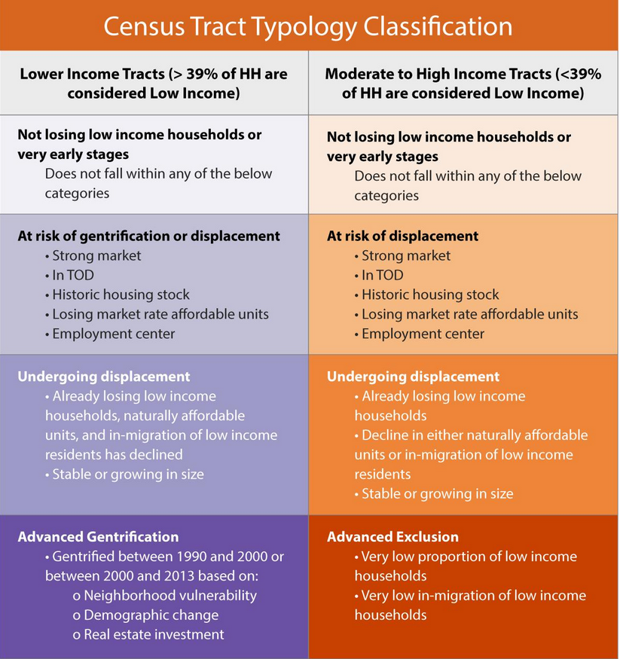
Berkeley planning professor Karen Chappleand her colleagues analyzed government housing, demographic, employment, transportation, land use, and policy data for 10-year intervals from 1990, 2000, and 2013. From this trove of information they gleaned historical red flags that signaled periods of low-income household displacement—things such as transit investment, loss of market-rate affordable housing units, and spikes in housing prices. Using this data, they divided the Bay Area into low-income tracts (where more than 39 percent of the households earned 80 percent less than the county’s median income), and high-income (which contained less than 39 percent low-income households).
They further divided each category into four stages of transformation based on historical displacement “risk factors.” Here’s the color-coded key that shows each category and its definition:
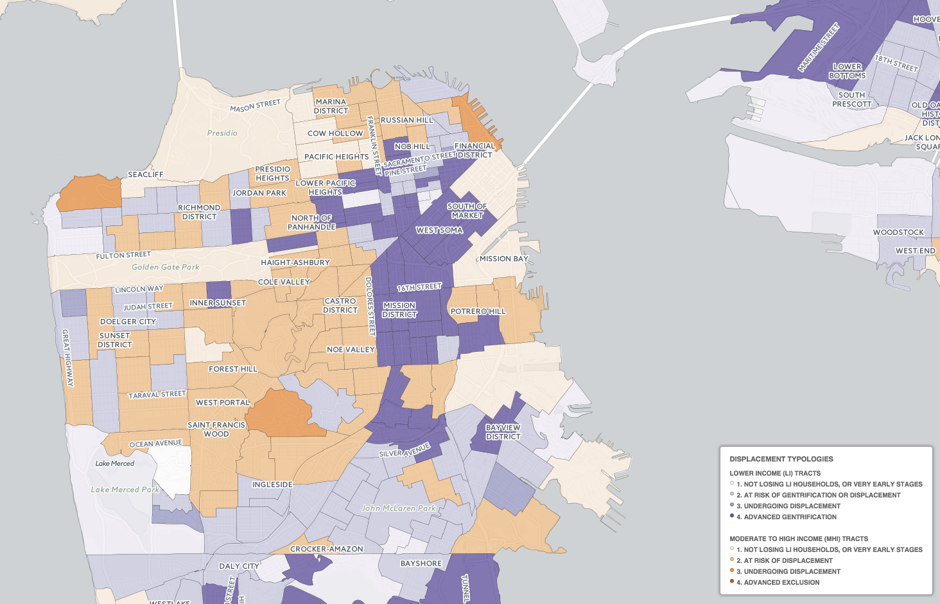
And here’s what San Francisco looks like, based on these categories:
According to the project’s accompanying report, a little more than half of the 1,569 total Census tracts are stable. About 48 percent are in the same boat as Mission District—they’re at some stage of transformation that entails, among other things, a loss of low-income residents (which the researchers use as a proxy for “displacement”). Far more tracts are “at risk”of displacing their poor residents (422) than are currently experiencing displacement (165). So if trends continue, many more neighborhoods might head the Mission District way.
“In 2030 ... many other Bay Area communities may realize that their neighborhood has turned the corner from displacement risk to reality,” Chapple writes in a related blog post.
Although “gentrification” and “displacement” are often used interchangeably, the project makes a clear distinction between the two. The researchers defined gentrification as a demographic or physical change, such as a rise in wealthier residents or in neighborhood investment. Meanwhile they viewed “displacement” as a loss of low-income residents—the one criterium that most research agrees on.
Many studies have failed to link gentrification and displacement, owing largely to the difficulty of tracking populations over time. The Urban Displacement Project found that, in some parts of the Bay Area, displacement followed gentrification and perhaps contributed to it. In others, displacement took place simultaneously or even came first. Here’s Chapple again, fleshing out the complex relationship between the two concepts:
Displacement can be physical (as building conditions deteriorate) or economic (as costs rise). It might push households out, or it might prohibit them from moving in, called exclusionary displacement. It can result from reinvestment in the neighborhood — planned or actual, private or public — or disinvestment.
Thus, displacement is often taking place with gentrification nowhere in plain sight. In fact, stable neighborhoods at both the upper and lower ends of the income spectrum are experiencing displacement.
The Urban Displacement Project also notes that transit investment and new development—often decried as harbingers of gentrification—can be beneficial, if planned inclusively. Here’s how they put it in their report:
Locals are likely to benefit from improved mobility, neighborhood revitalization, lower transportation costs, and other amenities that spill over from the new development (Cervero 2004). However, more disadvantaged communities may fail to benefit if the new development does not bring appropriate housing and job opportunities, or if there is gentrification that displaces low-income and/or minority residents
Still, it’s notable that more than 53 percent of low-income households in all of the Bay Area lived in neighborhoods that are experiencing, or at risk for, displacement and gentrification pressures. Since the project only analyzed data up till 2013, after which the region saw a surge in the region’s real estate market, these numbers might understate the reality on the ground.
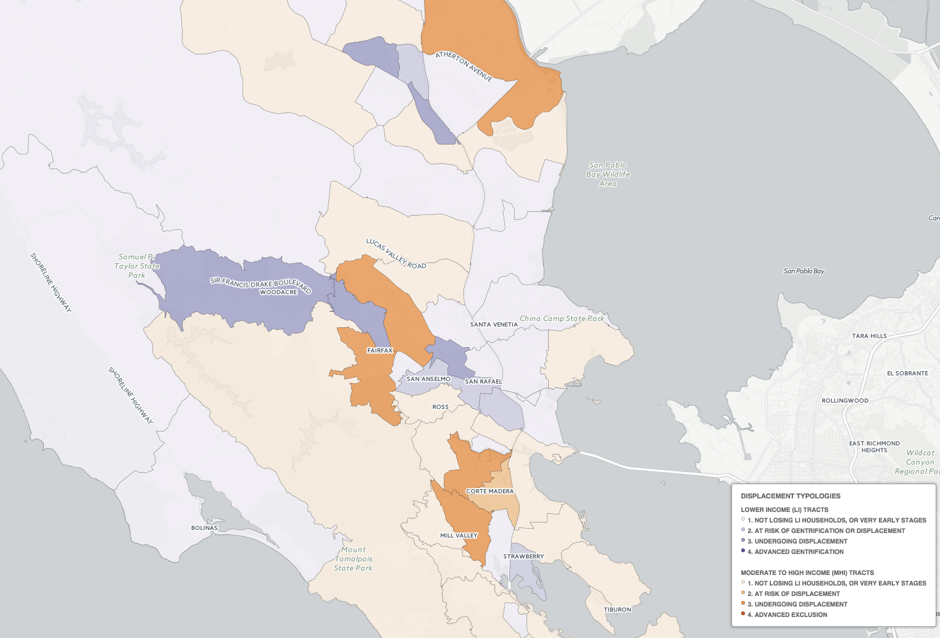
The map itself suggests some solutions. The research shows that places such asSan Francisco’s Chinatown, East Paolo Alto, and Marin County (below) have resisted displacement pressures through a combination of subsidized housing, tenant protections, and strong community organizing. They can serve as good models as cities prepare for the future.
While the map project is quite exhaustive, its ability to forecast the future is limited. Mobility data, for example, tells the researchers where low-income residents are leaving from but not where they’re are moving to, explains project director Miriam Zuk. Whether they left voluntarily or involuntarily is also hard to pin down.
These uncertainties make it hard for researchers to make more concrete estimates about where gentrification or displacement will take place next. Zuk and her colleagues are currently working with additional datasets to sharpen the map tool, but at the moment, it remains more a portrait than a predictio

No comments:
Post a Comment