Tuesday, July 10, 2018

Marin traffic is mostly local, study finds

Marin traffic is mostly local, study finds

Morning traffic crawls on southbound Highway 101 toward Terra Linda. The average daily trip length in Marin is 8.1 miles, 17 percent longer than the Bay Area average, according to a new study. (Robert Tong/Marin Independent Journal)
Morning traffic crawls on southbound Highway 101 toward Terra Linda. The average daily trip length in Marin is 8.1 miles, 17 percent longer than the Bay Area average, according to a new study. (Robert Tong/Marin Independent Journal) 
The Marin traffic study showed that 72 percent of trips were within the county and 24 percent were to or from the county. Pass-through traffic accounted for the rest. (Alan Dep/Marin Independent Journal)
The Marin traffic study showed that 72 percent of trips were within the county and 24 percent were to or from the county. Pass-through traffic accounted for the rest. (Alan Dep/Marin Independent Journal) 
Much of the traffic in Marin is from residents traveling within the county, according to a study using data collected from mobile devices that will be reviewed by the Transportation Authority of Marin later this month.
The agency commissioned the $30,000 study to get a better understanding of Marin’s travel patterns to help it make policy decisions.
More specifically, the agency wanted to examine the origin and destinations of commuters on Highway 101 at the Marin-Sonoma county line, Highway 37, the Richmond-San Rafael Bridge and the Golden Gate Bridge.
“It helps us understand the traffic patterns in the county,” said Kevin Johnson, of Walnut Creek-based Fehr and Peers, a transportation consultant group that produced the study, which was discussed Monday at TAM’s programming and projects executive committee meeting.
Marin residents might want to look in the mirror to see who causes county traffic woes. The data show that about 72 percent of trips are within Marin. Another 24 percent are trips in or out of the county, while 4 percent are passing through Marin during morning and afternoon peak periods.

See full article in the Marin IJ HERE

Editor's Note:  This report doesn't surprise the local residents who are not pushing housing and transit projects.  Hopefully, the politicians will recognize that "one size doesn't fit all" when it comes to development. This is why Plan Bay Area and regional government is doomed to fail.  Unless we move to 100% command economy like socialism, people will exercise their free choice and will seek to maximize their freedoms.  Simply building the SMART train and declaring it as a "traffic reduction" strategy doesn't make it so.  Building tax payer subsidized housing will never meet the need for affordable housing.  Unfortunately the progressives pushing all this nonsense never achieve their utopia and destroy freedoms instead. Just why are we funding TAM if they are not doing their job of improving transportation? 

What is Middle-Income Housing Affordability?

Charlotte, NC area

What is Middle-Income Housing Affordability?

Few local or metropolitan issues receive more attention than housing affordability. This article provides a perspective on housing affordability. The focus is on the approach used by the Demographia International Housing Affordability Survey, which I co-author annually with Hugh Pavletich (of performanceurbanplanning.org). The Demographia Survey has been published for 14 years. This edition includes housing affordability data and ratings for nearly 300 cities (metropolitan areas) in nine nations (Note 1).

What is Housing Affordability?

Housing affordability is the relationship between housing costs and income. Affordability can only be evaluated if there is a comparison to income. Yet, analysts and journalists often use refer to house prices or rents or their increases without relation to incomes to describe housing affordability. Prices are not an indicator of affordability if they are not compared to incomes but have only anecdotal value. Nor are house price or rent trends an indicator of affordability without comparison to incomes.

What is Middle-Income Housing Affordability?

Middle-income housing affordability is important, because affordable access to quality housing has been pivotal to the democratization of prosperity that occurred in the last century in most high-income nations. Normally, the competitive market has provided middle-income housing without the need for subsidies.
Middle-income is different from low – income housing (also called “affordable housing” or “social housing”), which relies on public subsidies to serve the needs of households unable to afford the house prices or rents prevailing on the open market. Focusing on middle-income does not indicate a lesser interest in low-income housing, because subsidy eligibility requirements are tied to house prices. Better housing affordability translates into fewer households seeking housing subsidies through affordable housing programs (and less public expense).
There are two principal dimensions of middle-income housing affordability — between housing markets and within individual market over time.

Owned and Rented Housing Affordability

Housing affordability can be measured for both owned and rented housing. Price-to-income ratios are typical for owned housing, including the “median multiple” used in the Demographia Survey (below). Percentage of incomes spent on rents are often used to evaluate rental housing affordability.

The Importance of Middle-Income Housing Affordability

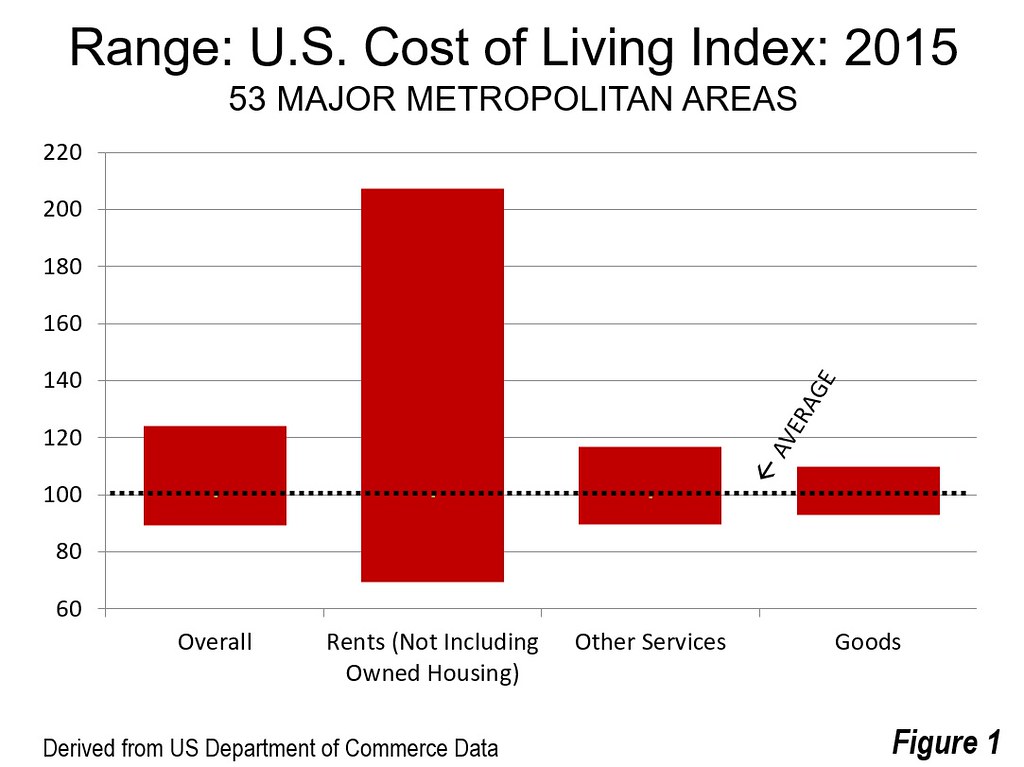
Housing is usually the largest budget item for households. The differences in housing costs between major metropolitan areas now increasingly drive differences in the costs of living. Housing costs also vary far more in their high to low range than in the other two major expenditure categories, according to the US Bureau of Economic Analysis, which are services not including rents and goods. (Figure 1).
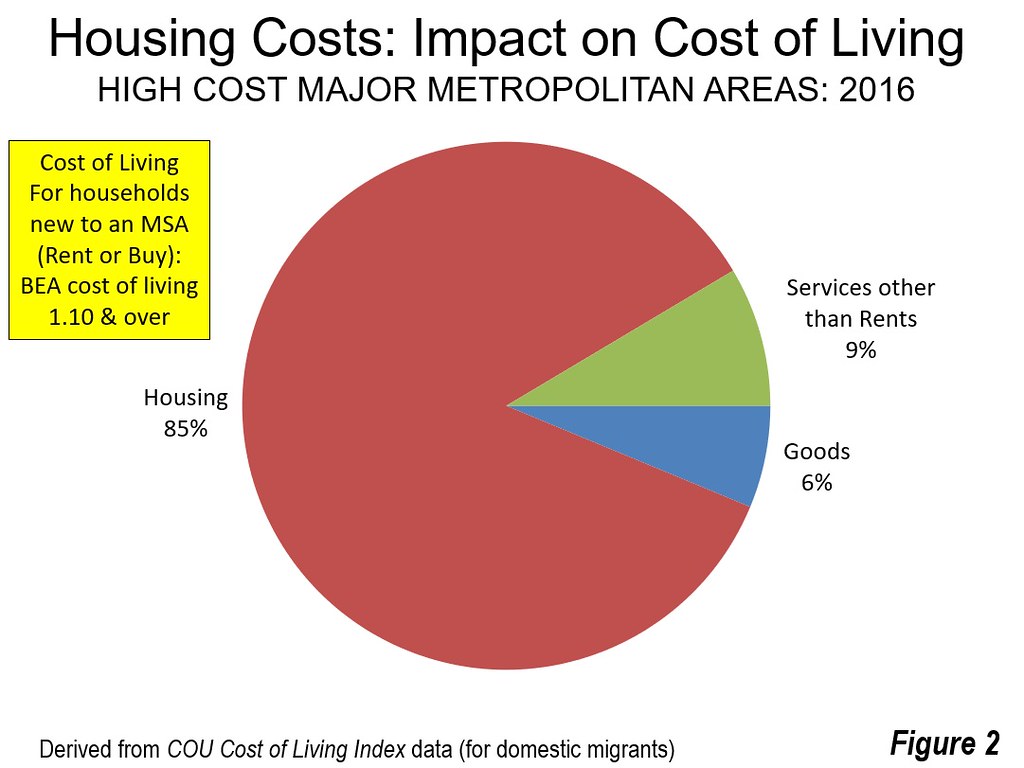
The differences are even greater when the costs of owned housing are included, as is illustrated by the COU “movers” cost of living index. This index estimates the cost of living for a domestic migrant household moving into the housing market and captures both the differences in rental and owned housing affordability. It is estimated that in the high-cost markets, 85 percent of the higher cost of living stems from higher housing costs (Figure 2).
Middle-income housing affordability is also important to the economy. Paul Cheshire of the London School of Economics and Wouter Vermeulen of VU University wrote, “… [h]ousing being the dominant asset in most households’ portfolios, there are also repercussions on saving, investment and consumption choices.” Where housing is more affordable, households will have more discretionary income to purchase additional goods and services and to save (which generates investment). All of this can contribute to job creation and a stronger economy.
Not only do higher house prices lead to a lower standard of living, but can also increase poverty. For example, California has the highest housing cost adjusted poverty rate among the 50 states of the United States, at 20.4%. This compares to California’s 14.5% rate without adjustment for housing costs.

Owned Housing Affordability Metrics

One of the most utilized owned housing affordability metrics is the price-to-income ratio. A United Nations publication indicated:
“If there is a single indicator that conveys the greatest amount of information on the overall performance of housing markets, it is the house price-to-income ratio. It is obviously a key measure of housing affordability. When housing prices are high relative to incomes, other things being equal, a smaller fraction of the population will be able to purchase housing.”
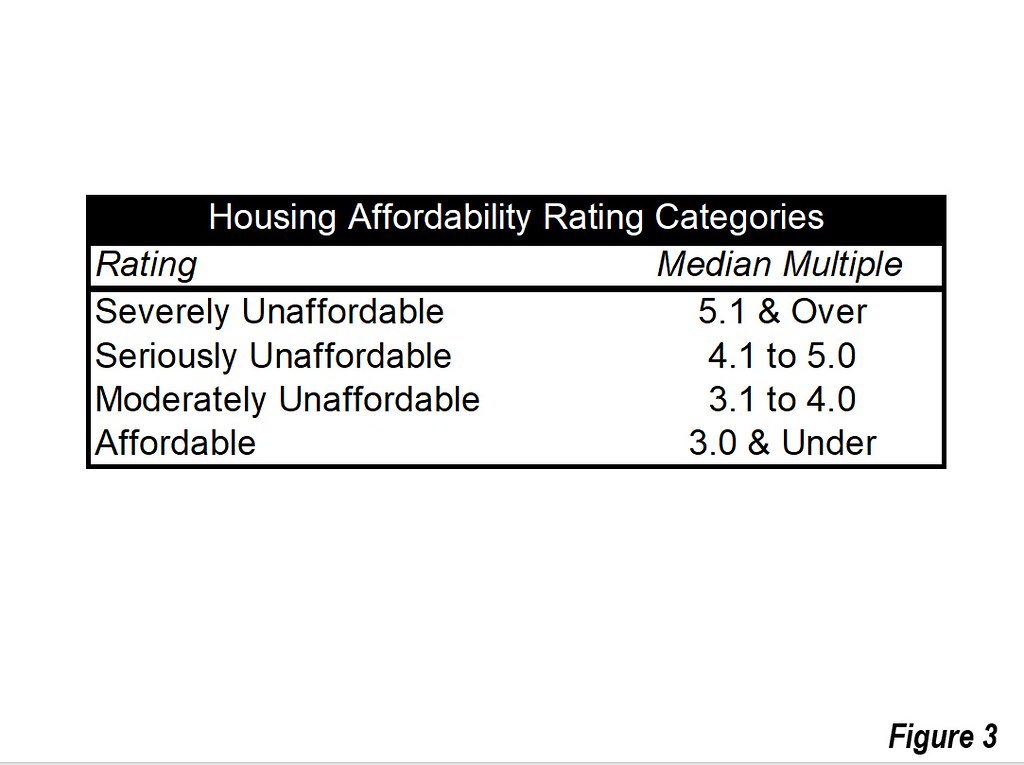
The Demographia International Housing Affordability Survey uses the median multiple (median house price divided by median household income). The evaluation criteria is in Figure 3.

The Geography of Housing Affordability

Demographia evaluates housing affordability between housing markets: Housing markets are coterminous with labor markets (metropolitan areas). Within housing markets, there will typically be a large urban area, which is defined an expanse of contiguous built-up land (see Demographia World Urban Areas). The area beyond the urban periphery is defined as the urban fringe, which is generally the land between the principal urban area and the boundaries of the metropolitan area. Typically, the urban fringe contains virtually all of the greenfield (undeveloped) land that can be used for new housing. Much of the growth of urban areas that has occurred since World War II in Australia, Canada, New Zealand, and the United States has been in detached housing tracts in greenfield areas.
Thus, for example, the New York housing market includes the entire New York metropolitan area, which stretches from Montauk Point on Long Island (east) to Pike County, Pennsylvania (west) to Ocean County, New Jersey (south) and to Dutchess County (north). The city of New York and other municipalities are only parts of the New York housing market.
Housing affordability may also be evaluated within a housing market. For example, the housing affordability in Brooklyn can be compared to that of White Plains. Or, housing affordability can be compared between more local neighborhoods, like Rainier Valley and Ballard in Seattle. Demographia evaluates housing affordability only at the housing market level and thus does not evaluate housing affordability between areas within housing markets.

The Time Dimension of Housing Affordability

The other important housing affordability comparison is historical, or over time. Thus, housing affordability may be compared for the same or multiple housing markets between 2000 and 2017.

The Need for Clarity

As many cities evaluated by Demographia suffer severe housing affordability, evaluations need to be conducted with sufficient clarity. Serious housing affordability evaluation requires comparison that includes incomes, as well as comparisons between housing markets and over time. In fact, much of the nation remains affordable by historic standards — severe unaffordability is limited to a minority of markets. The public is misled by analyses that fail to include both prices and incomes (See related article: “Housing Affordability from Vancouver to Sydney and Toronto: Time to Do What Works“).
Note 1: Metropolitan areas are “economic cities,” generally not related to the physical jurisdictions of cities as local government authorities, which may be larger or smaller than metropolitan areas.
Note 2: Parts of this article are adapted from published materials I have authored or co-authored.
Wendell Cox is principal of Demographia, an international public policy and demographics firm. He is a Senior Fellow of the Center for Opportunity Urbanism (US), Senior Fellow for Housing Affordability and Municipal Policy for the Frontier Centre for Public Policy (Canada), and a member of the Board of Advisors of the Center for Demographics and Policy at Chapman University (California). He is co-author of the “Demographia International Housing Affordability Survey” and author of “Demographia World Urban Areas” and “War on the Dream: How Anti-Sprawl Policy Threatens the Quality of Life.” He was appointed to three terms on the Los Angeles County Transportation Commission, where he served with the leading city and county leadership as the only non-elected member. He served as a visiting professor at the Conservatoire National des Arts et Metiers, a national university in Paris.

Monday, July 9, 2018

California’s Climate Extremism


California’s Climate Extremism

https://www.city-journal.org/html/californias-climate-extremism-16002.html


Joel KotkinJuly 3, 2018
California
Infrastructure and energy


Environmental extremism increasingly dominates California. The state is making a concerted attack on energy companies in the courts; a bill is pending in the legislature to fine waiters $1,000—or jail them—if they offer people plastic straws; and UCLA issued a report describing pets as a climate threat. The state has taken upon itself the mission of limiting the flatulence of cows and other farm animals. As the self-described capital of the anti-Trump resistance, California presents itself as the herald of a green, more socially and racially just society. That view has been utterly devastated by a new report from Chapman University, in which coauthors David Friedman and Jennifer Hernandez demonstrate that California’s draconian anti-climate-change regime has exacerbated economic, geographic, and racial inequality. And to make things worse, California’s efforts to save the planet have actually done little more than divert greenhouse-gas emissions (GHG) to other states and countries.

Jerry Brown’s return to Sacramento in 2011 brought back to power one of the first American politicians to embrace the “limits of growth.” Brown has long worried about resource depletion (including such debunked notions as “peak oil”), taken a Malthusian approach to population growth, and opposed middle-class suburban development. Like many climate-change activists, he has limitless confidence in the possibility for engineering a green socially just society through “the coercive power of the state,” but little faith that humans can find ways to address the challenge of climate change. If Brown’s “era of limits” message in the 1970s failed to catch on with the state’s voters, who promptly elected two Republican governors in his wake, he has found in climate change a more effective rallying cry, albeit one that often teeters at the edge of hysteria. Few politicians can outdo Brown for alarmism; recently, he predicted that climate change will cause 3 to 4 billion deaths, leading eventually to human extinction. To save the planet, he openly endorses a campaign to brainwash the masses.

The result: relentless ratcheting-up of climate-change policies. In 2016, the state committed to reduce greenhouse-gas (GHG) emissions 40 percent below 1990 levels by 2030. In response, the California Air Resource Board (CARB), tasked with making the rules required to achieve the state’s legislated goals, took the opportunity to set policies for an (unlegislated) target of an 80 percent reduction below 1990 levels by 2050.

Brown and his supporters often tout their policies as in line with the 2015 Paris Agreement, note Friedman and Hernandez, but California’s reductions under the agreement require it to make cutbacks double those pledged by Germany and other stalwart climate-committed countries, many of which have actually increased their emissions in recent years, despite their Paris pledges.

Governor Brown has preened in Paris, at the Vatican, in China, in newspapers, and on national television. But few have considered how his policies have worked out in practice. California is unlikely to achieve even its modest 2020 goals; nor is it cutting emissions faster than other states lacking such dramatic legislative mandates. Since 2007, when the Golden State’s “landmark” global-warming legislation was passed, California has accounted for barely 5 percent of the nation’s GHG reductions. The combined total reductions achieved over the past decade by Ohio, Georgia, Pennsylvania, and Indiana are about 5 times greater than California’s. Even Texas, that bogeyman of fossil-fuel excess, has been reducing its per-capita emissions more rapidly.

In fact, virtually nothing that California does will have an impact on global climate. California per-capita emissions have always been relatively low, due to the mild climate along the coast, which reduces the need for much energy consumption on heating and cooling. In 2010, the state accounted for less than 1 percent of global GHG emissions; the disproportionately large reductions sought by state activists and bureaucrats would have no discernible effect on global emissions under the Paris Agreement. “If California ceased to exist in 2030,” Friedman and Hernandez note, “global GHG emissions would be still be 99.54 percent of the Paris Agreement total.”

Many of California’s “green” policies may make matters worse. California, for example, does not encourage biomass energy use, though the state’s vast forested areas—some 33 million acres— could provide renewable energy and reduce the excessive emissions from wildfires caused by years of forest mismanagement. Similarly, California greens have been adamant in shutting down nuclear power plants, which continue to reduce emissions in France, and they refuse to count hydro-electricity as renewable energy. As a result, California now imports roughly one-third of its electricity from other states, the highest percentage of any state, up from 25 percent in 2010. This is part of what Hernandez and Friedman show to be California’s increasing propensity to export energy production and GHG emissions, while maintaining the fiction that the state has reduced its total carbon output.

Overall, California tends to send its “dirty work”—whether for making goods or in the form of fossil fuels—elsewhere. Unwanted middle- and working-class people, driven out by the high cost of California’s green policies, leave, taking their carbon footprints to other places, many of which have much higher per-capita emission rates. Net migration to other, less temperate states and countries has been large enough to offset the annual emissions cuts within the state. Similarly, the state’s regulatory policies make it difficult for industrial firms to expand or even to remain in California. Green-signaling firms like Apple produce most of their tangible products abroad, mainly in high-GHG emitting China, while other companies, like Facebook and Google, tend to place energy-intensive data centers in other, higher GHG emission states. The study estimates that GHG emissions just from California’s international imports in 2015, and not even counting imports from the rest of the U.S., amounted to about 35 percent of the state’s total emissions.

California’s green regulators predict that the implementation of ever-stricter rules related to climate will have a “small” impact on the economy. They point to strong economic and job growth in recent years as evidence that strict regulations are no barrier to prosperity. Though the state’s economic growth is slowing, and now approaches the national average, a superficial look at aggregate performance makes a seemingly plausible case for even the most draconian legislation. California, as the headquarters for three of the nation’s five largest companies by market capitalization—Alphabet, Apple, and Facebook— has enjoyed healthy GDP growth since 2010. But in past recoveries, the state’s job and income growth was widely distributed by region and economic class; since 2007, growth has been uniquely concentrated in one region—the San Francisco Bay Area, where employment has grown by nearly 17 percent, almost three times that of the rest of the state, with growth rates tumbling compared with past decades.

Some of these inequities are tied directly to policies associated with climate change. High electricity prices, and the war on carbon emissions generally, have undermined the state’s blue-collar sectors, traditionally concentrated in Los Angeles and the interior counties. These sectors have all lost jobs since 2007. Manufacturing employment, highly sensitive to energy-related and other regulations, has declined by 160,000 jobs since 2007. California has benefited far less from the national industrial resurgence, particularly this past year. Manufacturing jobs—along with those in construction and logistics, also hurt by high energy prices—have long been key to upward mobility for non-college-educated Californians.

As climate-change policies have become more stringent, California has witnessed an unprecedented level of bifurcation between a growing cadre of high-income earners and a vast, rapidly expanding poor population. Meantime, the state’s percentage of middle-income earners— people making between $75,000 and $125,000—has fallen well below the national average. This decline of the middle class even occurs in the Bay Area, notes a recent report from the California Budget and Policy Center, where in 1989 the middle class accounted for 56 percent of all households in Silicon Valley, but by 2013, only 45.7 percent. Lower-income residents accounted for 30.3 percent of Silicon Valley’s households in 1989, and that number grew to 34.8 percent in 2013.

Perhaps the most egregious impact on middle and working-class residents can be seen in housing, where environmental regulations, often tied directly to climate policies, have discouraged construction, particularly in the suburbs and exurbs. The state’s determination to undo the primarily suburban, single-family development model in order to “save the planet” has succeeded both in raising prices well beyond national norms and creating a shortfall of some 3 million homes.

As shown in a recent UC Berkeley study, even if fully realized, the state’s proposals to force denser housing would only reach about 1 percent of its 2030 emissions goals. Brown and his acolytes ignore the often-unpredictable consequences of their actions, insisting that density will reduce carbon emissions while improving affordability and boosting transit use. Yet, as Los Angeles has densified under its last two mayors, transit ridership has continued to drop, in part, notes a another UC Berkeley report, because incentives for real-estate speculation have driven the area’s predominantly poor transit riders further from trains and buses, forcing many to purchase cars.

Undaunted, California plans to impose even stricter regulations, including the mandatory installation of solar panels on new houses, which could raise pricesby roughly $20,000 per home. This is only the latest in a series of actions that undermines the aspirations of people who still seek “the California dream;” since 2007, California homeownership rates have dropped far more than the national average. By 2016, the overall homeownership rate in the state was just under 54 percent, compared with 64 percent in the rest of the country.

The groups most affected by these policies, ironically, are those on whom the ruling progressives rely for electoral majorities. Millennials have seen a more rapid decline in homeownership rates compared with their cohort elsewhere. But the biggest declines have been among historically disadvantaged minorities—Latinos and African-Americans. Latino homeownership rates in California are well below the national average. In 2016, only 31 percent of African-Americans in the Bay Area owned homes, well below the already low rate of 41 percent black homeownership in the rest of nation. Worse yet, the state takes no accountof the impact of these policies on poorer Californians. Overall poverty rates in California declined in the decade before 2007, but the state’s poverty numbers have risen during the current boom. Today, 8 million Californians live in poverty, including 2 million children, by far the most of any state. The state’s largest city, Los Angeles, is also now by some measurements America’s poorest big city.

To allay concerns about housing affordability, the state has allocated about $300 million from its cap-and-trade funds for housing, a meager amount given that the cost of building affordable housing in urban areas can exceed $700,000 per unit. These benefits are dwarfed by those that wealthy Californians enjoy for the purchase of electric cars and home solar: Tesla car buyers with average incomes of $320,000 per year got more than $300 million in federal and state subsidies by early 2015 alone. By contrast, in early 2018, state electricity prices were 58 percent higher, and gasoline over 90 cents per gallon higher, than the national average, disproportionately hurting ethnic minorities, the working class, and the poor. Based on cost-of-living estimation tools from the Census Bureau, 28 percent of African-Americans in the state live in poverty, compared with 22 percent nationally. Fully one-third of Latinos, now the state’s largest ethnic group, live in poverty, compared with 21 percent outside the state.

In a normal political environment, such disparities would spark debate, not only among conservatives, but also traditional Democrats. Some, like failed independent candidate and longtime environmentalist Michael Shellenberger, have expressed the view that California’s policies have made it not “the most progressive state” but “the most racist one.” Recently, some 200 veteran civil rights leaders sued CARB, on the basis that state policies are skewed against the poor and minorities. So far, their voices have been largely ignored. The state’s prospective next governor, Gavin Newsom, seems eager to embrace and expand Brown’s policies, and few in the legislature seem likely to challenge them. The Republicans, for now, look incapable of mounting a challenge.

This leaves California on a perilous path toward greater class and racial divides, increasing poverty, and ever-more strenuous regulation. Other ways to reduce greenhouse gases—such as planting trees, more efficient transportation, and making suburbs more sustainable—should be on the table. The Hernandez-Friedman report could be a first step toward addressing these issues, but however it happens, a return to rationality is needed in the Golden State.

Joel Kotkin serves as Presidential Fellow in Urban Futures at Chapman University and executive director of the Center for Opportunity Urbanism

Steelhead or Salmon near Miwok Burial Ground


Video of what I believe to be steelhead trout spawn in Miller Creek near the Miwok Indian Burial Mound on Miller Creek Middle School..

Filmed July 19, 2017

The Social History of the Dixie District The Early Period- Before 1843 Indian Life

The Social History of the Dixie District

The Early Period- Before 1843
Indian Life

    historyThe Indians who lived in what is now the Dixie School District as early as 1,500 BC, and who may well have lived here for hundreds of years before that, were the Coast Miwok and their ancestors.  Culturally they were similar to the Pomo Indians, their neighbors to the north; however, they spoke a different language.
    Coast Miwok Indians lived in tribelets which consisted of a central village and several associated settlements, and might include 100 or more people.  Each tribelet had a headman (hoipu) or headwoman (maien), who was an adviser and settler of disputes.  This person also welcomed and entertained visitors and was responsible for making speeches on special occasions.

    The triblet which lived in the valleys which are now Terra Linda and Lucas Valley- Marinwood identified themselves with the central village site, Cotomko’tca (Grasshopper Houses), which is behind Miller Creek School.  Editor's Note: Charles Slaymaker, preeminent archealogist has mapped SEVENTEEN Miwok settlement sites within Marinwood Park and Miller Creek School.  It was the central village location for the Coastal Miwok people in Eastern Marin County.


    The Coast Miwok were hunters and gatherers.  Food in great variety and abundance could be found in the pleasant climate.  From the bay and marsh lands, which then extended to what is now Highway 101, they took shellfish, fish and water fowl.  Rabbits and quail were always available, and in the hills and valleys could be found deer, elk and antelope.  Wild berries, roots and bulbs provided fruit and vegetables.  A staple of their diet was the ample supply of acorns from the huge oaks found throughout this area.
Because of the mild climate, single family shelters made of reeds called tules were not expected to last more than a season or two.  Sweat houses, which were semi-subterranean, framed with wood and roofed with woven branches, tules and clay, were more permanent structures.  Like many other California Indians, the people of Marin used sweat houses for purification and cleansing before hunting, and as meeting and sleeping quarters for the men.
    Each central village community had a dance house, a circular, semi-subterranean building with the floor 30 to 50 feet in diameter.  Several of these floors, at different levels, the remnants of dance houses dating from different periods in time, have been found by archeologists at Cotomko’tca on Miller Creek.
    Ceremonies and dances played a large part in tribelet life.  Elaborate feather costumes and headdresses, decorated with bone hairpins, shell beads and abalone ornaments, as well as special body paint designs, were used for these dances.  Some dances were accompanied by cocoon or split-stick rattles, whistles, and foot drums, as well as by singers.  Bone and shell fragments, all that remain of the beautiful costumes, have been found at Miller Creek.
    Often found in Marin are stone mortars and pestles, used for grinding acorns, other seeds and body paints.  Less well known are the Coast Miwok Baskets.  The few specimens still remaining show fine workmanship.  Early descriptions and basketry impressions in clay from archeological sites confirm the basketry was a highly developed are.  Large conical baskets supported by tumplines around the forehead were used to carry bulky and heavy loads.  Watertight baskets were used for cooking; hot rocks dropped into the basket’s contents brought them quickly to a boil.  Finely wrought hairnets, as well as nets used for trapping small animals and birds, were further evidences of the weavers’ skill.
    Boats used by the Coast Miwok were made of tules bundled and tied in a canoe-like shape.  Indians with such a vessel in San Francisco Bay appear in an 1816 painting; Drake’s chronicler, Fletcher, described a similar craft.
    Clothing was needed only in inclement weather.  Men usually wore nothing; women wore skirts or aprons of shredded bark or tules, or fringed deerskin.  Woven fur blankets were also worn.  Hair was worn loose, confined in a net, or tied up in a knot or club.  Women’s chins were sometimes tattooed; both men and women wore ornaments in their pierced ears or noses.
    Chipped stone was used for many purposes.  Chert, which is native to Marin, is common in archeological sites in the form of cutting tools, scrapers and drills.  Obsidian, volcanic glass traded from northern California, was fashioned into projectile points for arrows and spears, as well as knives, and into large blades with no practical use but valued as items of wealth.
    Round white clam disk beads were made and traded widely as a form of money.  The small olive shell beads were decorative only.  From abalone shells were made pendants and ornaments for dance costumes.  All of these have been found at Miller Creek.
    Early explorers fond Bay Area Indians to be peaceful and friendly.  Accounts by Francis Fletcher who accompanied Francis Drake (1579), Cermenho (1595), whose ship was wrecked off Limantour Spit, and Father Vicente Santa Maria who accompanied Ayala (1775) on the San Carlos, the first ship to enter San Francisco Bay, all remark on the Indians’ friendliness and lack of antagonism toward the newcomers.  
Mission Period
    In 1776 the Mission Dolores in San Francisco was founded.  Coast Miwok Indians, tempted by offers of food and clothing and by religious ceremonies, music and processions were taken there early, as well as to the missions at Santa Clara and San Jose.  The people of Cotomko’tca were close to the main travel route along the bay shore and probably were among the first to go.
    The Indians were accustomed to the hard work of procuring and preparing food and shelter.  However, their work schedule was tied to need and to seasonal food supplies.  At the missions a set daily work routines was enforced.  Indians were also hired out to work for the military establishment at the Presidio.  Any payment for this work went to the missions, rather than to the Indians.  Those who attempted to leave and return to their homes and previous ways of life were brought back by soldiers and punished.
    Poor nutrition, even famine, contributed to the Indians’ dissatisfaction with mission life.  Tuberculosis infected many.  In 1816, a measles epidemic killed almost every child under 10 at the Mission Dolores.
    In 1817 the Mission San Rafael was founded as an asistencia, or hospital mission, to try to cope with the widespread illness among the mission inhabitants.  Upon its opening, the Marin Indians who were still free were brought into the mission system.
When the missions were secularized between 1834 and 1836, a large tract of land was set aside in the Nicasio area for the surviving Marin Indians.  This soon was taken over by ranchers, and the few remaining Coast Miwok were relegated to menial jobs if they were employed at all.  Although there were a few attempts at self defense and even rebellion, which were well publicized and used to justify strong suppressive measures, the history of these people was coming to an end.  None are left today.
Syliva B. Thalman
Miwok Archeological Preserve of Marin

Saturday, July 7, 2018

A Politician defends the Tyranny of Regional Government


A citizen speaks out at the May 19, 2016 Association of Bay Area Governments Regional Assembly.  He questions the legality and constitutionality of "regional government" where citizens don't even know about the meetings.  Scott Haggerty, Alameda County Supervisor responds to quiet the citizen (peasant) citing privilege of elected office.


Comment from a viewer:

Article IV, Section 4 of the Constitution forbids forms of government that are not vetted by the citizenry. Regional Governments like ABAG and SCAG are the definition of this illegal activity and should be abolished.


"Wild Thing" by the Troggs

CityBldr will start buying up homes and breaking up neighborhoods with their development tool.


CityBldr Bryan Copley in at the startup’s Seattle headquarters. (GeekWire Photo / Monica Nickelsburg)

Seattle startup CityBldr is getting into the home buying game, taking on real estate heavyweights in its backyard. But unlike Zillow and Redfin, which have both started buying properties directly from homeowners, CityBldr is targeting homes that can be converted into multi-family residences.
CityBldr’s software identifies underutilized land in cities, like Seattle, and makes connections between homeowners and developers to repurpose properties. For example, CityBldr helped seven homeowners in the Seattle area realize that if they sold their properties as a bundle to a real estate developer, they could make more money. Going forward, CityBldr will start buying properties like those directly, then sell them to builders and developers who will convert single-family homes into multi-unit residential buildings.
“We’re only going to be targeting properties that are zoned for multi-family development,” CityBldr CEO Bryan Copley said. “The big problem we’re trying to solve is that everybody’s moving to the city and there aren’t enough homes in the city to accommodate that growth.”
CityBldr will start buying houses sometime in the fourth quarter of 2018 or first of 2019. The startup is currently raising its Series A round and searching for a Chief Investment Officer to oversee the home buying business. Copley says that CityBldr should be able to guarantee a higher price on properties it targets because the resale value to real estate developers is higher than the listing price for a home that would be resold as a single-family residence.
“The reason we’re able to do that is we’ve built a tool that understands the development potential of every property … Instead of only looking at what would a homebuyer pay for that property, we look at what would an investor or builder or developer be able to pay for that property,” Copley said.
CityBldr is taking a different approach than Zillow, Redfin, and Opendoor, the incumbent instant offers company based in San Francisco. Opendoor just raised a whopping $325 million to expand into new markets and defend against new challengers. Unlike CityBldr, all of those companies are buying homes to sell to other home buyers, not brokering deals to convert properties into multi-unit buildings.
“We’re not competing with Zillow and Redfin directly on their instant offer,” Copley said. “We just believe that property owners will come to CityBldr first to see if they can get a better offer than all the other companies looking at the same underwriting for the property.”

Friday, July 6, 2018

How Erik Dreikosen, Marinwood CSD Manager FOOLED me to conceal the Maintenance Shed Environmental Review

Eric Dreikosen, Marinwood CSD manager on June 12, 2018 when he denied the existence of a pending application for Marinwood Maintenance facility on June 15, 2018.  His deliberately misleading statement was continued in this email exchange below.  Even at the June 26, 2018 Parks and Recreation meeting, the application was kept secret.  Finally, it was revealed on Friday, June 30, 2018 at 5 pm before a major holiday. A legal notice was published on Saturday, July 1, 2018.
Clearly the Marinwood CSD will go to great lengths to keep their activities secret.

At the June 12th Marinwood CSD meeting, I asked Eric Dreikosen about the pending application for the Marinwood Maintenance shed. He answered evasively to imply no actions with the permission of the board .  


Several days later on June 15th, he signed and submitted a 109 page "Neg Dec for Environmental Review that will allow the Marinwood CSD to build WITHOUT CUSTOMARY ENVIRONMENTAL OVERSIGHT.

This particularly upsetting since the current Hansell design calls for a massive 4400 square foot compound that is 100% within the stream conservation setback of 120 feet.  However, since Marinwood CSD is their own oversight "lead agency", of course they will approve their own work. 

Here is an email exchange I had several days later :


=========================================================

Jun 18

Stephen Nestel to Eric Dreikosen, Marinwood CSD Manager


Eric,


What day will you submit your application for the Marinwood Maintenance Facility? Previously, you mentioned that you hoped to have an application to submit in late June 2018.


What day will you submit and meet with the planners? Who is the county planner for this project who is assigned to your project?


Thank you in advance.

Editor's note: Notice that I did not specify which application.  An honest answer would have been that a 109 page NEG DEC EIR document had been submitted three days earlier.


========================================================


Jun 19

Eric Dreikosen  to me


Dear Stephen,

The District does not have a set date as to when the Site Plan Review Application will be submitted. As no such application has yet been submitted, there has been no planner assigned on behalf of the County.


Eric

Editor's note: Dreikosen is purposely evasive but changing the subject.  He intentionally is trying to confuse Site Plan Review Application with Neg Dec EIR 
UPDATE 7/7/2018: Eric Dreikosens own May 2018 memo indicates that a Site Plan Review Application will be submitted at the end of June  (see the last paragraph).  Suddenly, Eric Dreikosen is having amnesia and calling the document something else.  This is a deliberate attempt to deceive the public. We deserve to have employees worthy of trust.

=========================================================

Jun 19

Stephen Nestel to Eric Dreikosen


Approximately, when do you think the submission will occur? Is it still the end of June or has their been a delay? Will you please notify upon submission?


============================================================


Jun 20 


Eric Dreikosen  
to me


Dear Stephen,


The District continues in its due diligence with the pre-planning process. With that, I do not have an approximate date as to when the Site Plan Review Application will be submitted. All proper notices will go out at the appropriate times as we move forward with this initiative.

Thanks,

Eric

Editor's Note: Dreikosen continues to mislead me. He knows that I want to engage in productive dialogue but still conceals his actions.
============================================================


Jun 20


Stephen Nestel to Eric


Thanks for your prompt reply. There was a promise of a public meeting prior to submitting the application at the last impromptu presentation. Is this part of the due diligence that you are referring too? I know the public wishes to engage with this topic and the best way is to be transparent. I hope to minimize the unnecessary misunderstandings prior to submitting so the district can save time and money on the project.


The current iteration of the Maintenance Shed project has many challenges. The first challeng is establishing a policy of what activities can take place on the site. The current landscaping waste, materials depot and haphazard storage of materials and equipment is a relatively recent phenomena. 1.) Will this be allowed in the future? 2.) Does the structure serve the practical applications envisioned? I don't see how the current large, long narrow building could practically accommodate the practical needs for tools, vehicle and materials storage plus a workshop and office. The workflow access is severely constricted by design. A conventional long garage such as one used in virtually every other government facility in Marin County will overcome this obstacle. The current design is definitely more attractive but due to its inefficient design, it will encourage the use OUTSIDE the building which defeats the purpose of a self contained facility. Of course a budget should be established too.


I believe the first two questions should be answered PRIOR to submitting a plan since changes will significantly alter the site plan and could cause delays.


The environmental issues will still need to be addressed but at least we can get the first important questions answered first.


I have long lobbied for a new maintenance facility and glad it is finally being addressed. Let's do something great.

(Eric Dreikosen does not respond to this email)
==========================================================================

Leah Green, Marinwood CSD Board President approved of the deception of the public at the June 12, 2018 meeting.  Izabella Perry, Bill Shea, Jeff Naylor and Irv Schwartz also were aware of the pending "Neg Dec EIR " document and did nothing to make the public aware of the 109 page document found HERE