Urban Planning For People
by Wendell Cox 01/02/2014

Progress In Automobile CO2 Emissions
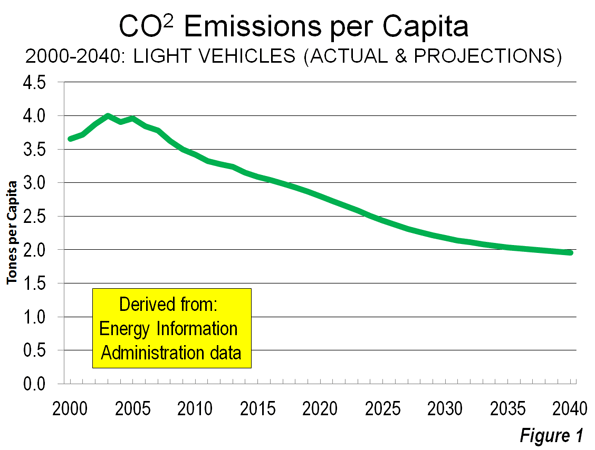
The new Annual Energy Outlook forecasts continuing and material progress in improving energy efficiency, reducing fossil fuel consumption and reducing carbon dioxide emissions from cars and light trucks (light vehicles). Per capita carbon dioxide emissions from light vehicles are projected by EIA to fall to 51 percent below the peak year of 2003 (Figure 1).
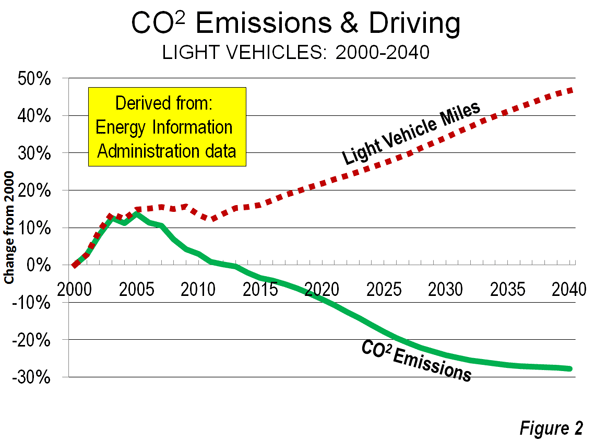
The gross (not per capita) 2040 carbon dioxide reduction from light vehicles is projected to decline 28 percent in 2040 from 2003. Most significantly, the reduction is to occur as gross driving miles increases 29 percent (Figure 2). The actual 2040 emissions are likely to be even lower, because the 2014 Annual Energy Outlook assumes no vehicle fuel economy improvements after 2025. Improvements in vehicle technologies and cars using alternative fuels, and under government incentives, seem likely.
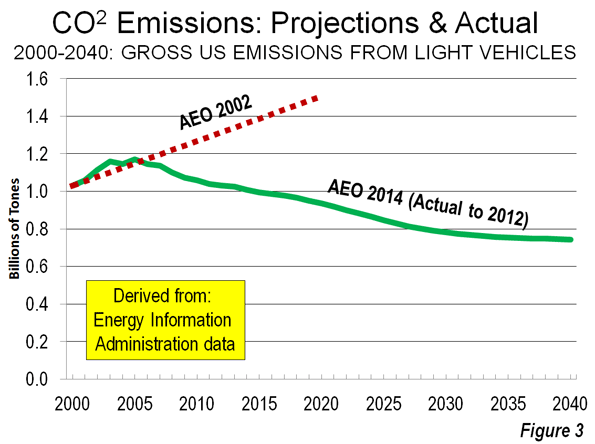
The emissions forecast improvements have been stunning, to say the least. The 2002 Annual Energy Outlook had expected a 46 percent increase in carbon dioxide emissions from light vehicles between 2000 and 2020. The revised forecast – which takes into account what actually has occurred – says there will be a 9 percent decrease.
This is the result of multiple factors. In 2002, EIA predicted a 55 percent increase in driving between 2000 and 2020. The 2014 Annual Energy Outlook revises that figure to 22 percent (Figure 3). Fuel economy is improving, which is being driven by stronger regulations as well as technological advances.
Driving is Down
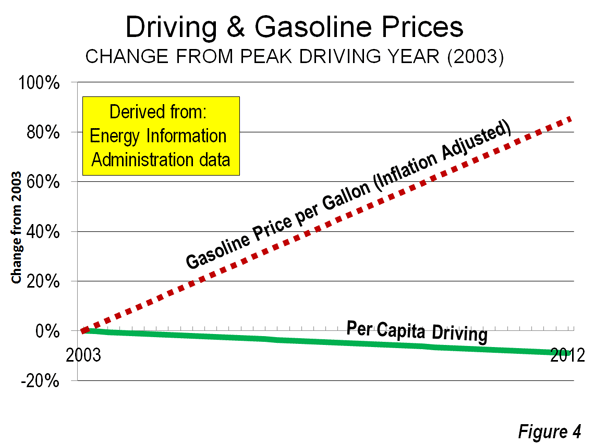
Driving per capita fell nine percent from the peak year of 2003 to 2012. This decline is not surprising given the sorry state of the economy and high unemployment. Gas prices have risen 85 percent (inflation adjusted) over the same period. The decline in driving is modest compared to the increase in gas prices – a 0.9 percent reduction in driving per capita for each 10 percent increase in gasoline (Figure 4), inflation adjusted. This is half or less the reduction in transit ridership that would be expected if fares were raised by the same percentage.
Meanwhile, little of this reduction in driving has been transferred to transit. The increase in transit per passenger miles per capita captured less than one percent of the driving decline. Indeed, the daily increase in per capita transit use is less than the perimeter of a 20-to-the-acre townhouse lot.
With fewer jobs, higher gas prices and the new reliance on social media, as well as a rise in people working at home, people may have become more efficient and selective in their driving patterns (such as by consolidating shopping trips). Certainly those with jobs use their cars for those trips above as much as before.
Meanwhile, the EIA forecasts that driving per capita will rise gain, once the economy is released from intensive care. However, with the near universality of automobile ownership, the potential for substantial increases is very limited.
Hiding Success?
It might be thought that the planning community, with its emphasis on reducing greenhouse gas emissions, would be rushing to incorporate these into their plans and even to herald the improvements.
Yet, this is not the case. San Francisco Bay Area planners hid behind over-reaching state directives to "pretend-it-was yesterday" and employed out of date forecasts for vehicle emissions.
Data in Plan Bay Area documentation shows that 95 percent of the projected improvement in greenhouse gas emissions would be from energy efficiency improvements. These have nothing whatever to do with its intrusive land use and transport strategies.
The additional five percent requires social engineering residents into "pack and stack" high density developments, virtually outlaw detached housing on plentiful urban fringe land and will likely cause even more intense traffic congestion.
California's high speed rail planners have made the same kind of mistake, using out-dated fuel economy data in their excessively optimistic greenhouse gas emissions reductions.
The Illusion of Transit Mobility
Part of the problem is an illusion that people in the modern metropolitan area can be forced out of their cars into transit, walking, and biking, without serious economic impacts (such as a lower standard of living and greater poverty).
Transit is structurally incapable of providing automobile competitive mobility throughout the metropolitan area without consuming much or all of its personal income (of course, a practical impossibility). But there is no doubt of transit effectiveness and importance in providing mobility to the largest central business districts (downtowns) with their astronomic employment densities (Note 1). Yet, outside the relatively small dense cores, automobile use is dominant, whether in the United States, Canada, Australia, or Western Europe. The transit legacy cities (municipalities) of New York, Chicago, Philadelphia, San Francisco, Boston, and Washington, with the six largest downtown areas account for 55 percent of all transit commuting in the United States.
The Delusion of Walking and Cycling as Substitutes for Driving
Illusion becomes delusion when it comes to cycling and walking. Walking and cycling work well for some people for short single purpose trips, especially in agreeable weather. However, walking and cycling are inherently unable to provide the geographical mobility on which large metropolitan areas rely to produce economic growth. True, cycling does approximate transit commute shares in smaller metropolitan areas, like Amsterdam, Rotterdam, and Bremen, but still accounts for barely a third of commuting by car according to Eurostat data. Prud'homme and Lee at the University of Paris and others have shown in their research that the economic performance of metropolitan areas is better where more of an area's employment can be reached within a specific period of time (such as 30 minutes). That leaves only a limited role for walking and cycling.
Toward an A Non-Existent Nirvana?
The "Nirvana" of a transit-, walking-, and cycling-oriented metropolitan area proves to be no Nirvana at all. We don't need theory to prove this point. Take Hong Kong, for example, with its urban population density six times that of Paris, nine times that of Toronto, 10 times Los Angeles, 12 times New York nearly 20 times Portland, and nearly 40 times that of Atlanta.
This vibrant, exciting metropolitan area cannot deliver on a standard of living that competes with Western Europe, much less the United States. Despite the high density, the overwhelming dominance of transit, walking, and cycling, Hong Kongers spend much longer traveling to and from work each day than their counterparts in all large US metropolitan areas, including New York and in most cases the difference is from more than 50 percent (as in Los Angeles) to nearly 100 percent.
The problem goes beyond the time that could be used for more productive for rewarding activities. Housing costs are the highest among the major metropolitan areas in the eight nations covered by the Demographia International Housing Affordability Survey. Hong Kong's housing costs relative to incomes are more than 1.5 times as high as in the San Francisco metropolitan area and almost five times as high as Dallas-Fort Worth. Meanwhile, the average new house in Hong Kong is less approximately 485 square feet (45 square meters), less than one-fifth the size of a new single family US American house (2,500 square feet or 230 square meters), though Hong Kong households, are larger (Note 2).
When households are required to spend more of their income for housing, they have less discretionary income and necessarily a lower standard of living. This loss of discretionary income trickles down to people in poverty, whose numbers are swelled by higher than necessary housing costs.
Planning is for People
Contrary to the current conventional wisdom, the prime goal of planning should not be to achieve any particular urban form. What should matter most is the extent to which a metropolitan area facilitates a higher standard of living and less poverty.
------------------
Note 1: In 2000, employment densities in the nation's six largest downtown areas (New York, Chicago, Washington, Boston, San Francisco and Philadelphia) was three times that of the downtowns in the balance of the 50 largest urban areas, and 14 times as dense as outside the downtown areas.
Note 2: According to the 2011 census, the average household size in Hong Kong was 2.9 persons. This is more than 10 percent larger than the US figure of 2.6 from the 2010 census.
-------
Wendell Cox is a Visiting Professor, Conservatoire National des Arts et Metiers, Paris and the author of “War on the Dream: How Anti-Sprawl Policy Threatens the Quality of Life.
Photo: Prius photo by Bigstock.
No comments:
Post a Comment