Brief video about Center of Opportunity Urbanism. They also produced a great white paper on Restoring Localism
Wednesday, January 3, 2018

San Fran City Planner: End Free market in Housing/Let Government Set Rental Rates/Housing Prices—AND Who Can Live in San Fran
San Fran City Planner: End Free market in Housing/Let Government Set Rental Rates/Housing Prices—AND Who Can Live in San Fran
December 13, 2016 By Stephen Frank 2 CommentsDid you believe the job of a “city planner” was to promote the free market, to allow residents to live where they want and can afford? If so, you are deadly wrong and the San Fran City Planning must have interned in Russia or other totalitarian State, not in a free nation.
“Rahaim said in the letter that his department will address the gentrification concerns by imposing a new set of special development and land use rules in the Mission as well as also other vulnerable neighborhoods, like South of Market and the Tenderloin.
“We know that there is simply not enough housing regionally or in San Francisco to meet our needs. We know that producing housing at all income levels is critical,” Rahaim wrote. “We also know that it will take a broad set of smart, bold strategies to address the totality of the causes and effects of high housing costs and displacement.”
The concerns over gentrification also come as city officials have declared homelessness a crisis. Federal officials last month said the region’s strong real estate market is a reason why homelessness increased in West Coast cities like San Francisco but declined overall throughout the nation by 14 percent since 2010.
How well does central planning work in San Fran? While the rest of the nation had a decline in homelessness is 14%, San Fran increased. This City Planner wants to make it worse—but will say it is the “government plan”. The Soviet Union is dead, San Fran is the new version.

SF Planning director calls gentrification ‘undeniable, and of serious concern’
by Joshua Sabatini, SF Examiner,12/12/16
The head of the Planning Department acknowledged in a letter Friday the severity of gentrification occurring in San Francisco amid the years-long development boom while also outlining measures underway to address it.
“The reality of displacement and gentrification across all of San Francisco — and the entire region — is undeniable, and of serious concern,” Planning Director John Rahaim wrote in a Dec. 9 letter to the Board of Supervisors.
The letter was in response to the board opposing last month a major residential development in the Mission amid community opposition centered on gentrification.
The board’s vote also created uncertainty for other proposed developments in the Mission District, seen as ground zero for the impacts of the technology boom, as well as projects planned for other communities.
Rahaim said in the letter that his department will address the gentrification concerns by imposing a new set of special development and land use rules in the Mission as well as also other vulnerable neighborhoods, like South of Market and the Tenderloin.
“We know that there is simply not enough housing regionally or in San Francisco to meet our needs. We know that producing housing at all income levels is critical,” Rahaim wrote. “We also know that it will take a broad set of smart, bold strategies to address the totality of the causes and effects of high housing costs and displacement.”
The concerns over gentrification also come as city officials have declared homelessness a crisis. Federal officials last month said the region’s strong real estate market is a reason why homelessness increased in West Coast cities like San Francisco but declined overall throughout the nation by 14 percent since 2010.
Rahaim said that the Planning Department is specifically addressing the concerns of gentrification in the Mission through the development of Mission Action Plan 2020, which he said would result in 1,000 affordable housing units in the Mission, and through the interim land use controls currently in place before that plan is finalized next year.
“We believe that MAP 2020 represents a national model for how urban neighborhoods might address issues of gentrification and displacement,” he said.
Since the technology boom began in 2010, encouraged by the tech-friendly policies of Mayor Ed Lee, gentrification has been at the heart of contentious political debates on a myriad of issues, including the “Google Bus,” transportation services like Uber and Lyft, Airbnb regulations, affordable housing requirements and eviction protections.
While San Francisco has greatly transformed during the past several years and many have left The City for more affordable locales, the debate around gentrification continues to unfold in community meetings and at City Hall.
Rahaim’s letter was prompted by the Board of Supervisors’ Nov. 15 vote to oppose a 159-unit development, of which 39 units would be affordable, at 1515 S. Van Ness Ave. in the Mission by Lennar Multifamily Communities. The board opposed the development by upholding an environmental review appeal filed under the California Environmental Quality Act.
The appeal was filed by the Calle 24 Latino Cultural District’s Executive Director Erick Arguello and argued the review was flawed by failing to address the impacts of gentrification, an argument that has been made previously without success for other projects.
The Nov. 15 vote was particularly charged. Arguello’s attorney Scott Weaver referred to how Mission gentrification had ushered in the era of the $6 croissant, the $100-per-person meal or the $350 handbag for sale on Valencia Street.
“The gentrification we’ve seen on Valencia and on Mission [streets] is the beginning. What is to come is an overwhelming economic force that will change the face of the Mission and of the Calle 24 Latino Cultural District,” Weaver said at the time.
It was the comments of Sonja Trauss, founder of pro-development group San Francisco Bay Area Renters’ Federation, that backfired and seemed to hand opponents a win when she likened the Mission advocates’ opposition to the project to politics akin to President-elect Donald Trump.
“I’ve always been disturbed by nativism in San Francisco,” Trauss said at the time. “And when you come here to the Board of Supervisors and say that you don’t want new, different people in your neighborhood you’re exactly the same as Americans all over the country that don’t want immigrants.”
Supervisor David Campos, who represents the Mission, called out Trauss’ comments specifically when saying he was planning to reject the appeal but changed his mind.
The Calle 24 Latino Cultural District is a 14-block area, wherein the project is proposed, created by The City in 2014 to officially acknowledge the Latino legacy in the area and support regulations to protect it.
Many of the same opponents of the Lennar project also backed a previously proposed moratorium on market-rate housing for the Mission neighborhood.
In 2015 Campos proposed the moratorium to create a “pause” of development of market-rate units – the proposal would have allowed 100 percent affordable housing development – to buy some time to create a long-term plan to combat gentrification.
The moratorium proposal inspired countless debates around supply and demand in the housing market. After the board failed to approve the moratorium, it was subsequently placed on the ballot and rejected by voters.
Moratorium opponents argued that The City needs housing of all income levels and that market-rate development is a vital funding source for affordable housing. Developers are required to include a percentage of units onsite or pay in-lieu fees to The City, which then uses them to fund affordable housing projects.
In his letter, Rahaim cites several statistics to illustrate socio-economic challenges residents face.
“In 2013, 45 percent of renters paid more than 30 percent of their income for rent; that means that nearly half of renters in San Francisco are rent burdened,” the letter reads. “Evictions are taking place across The City, with the Mission, Richmond, Sunset, Excelsior, Tenderloin, and Lakeshore neighborhoods having the highest eviction notices in 2015 and 2016. The Latino population in the Mission had declined to 39 percent in 2014, down from 50 percent in 2000.”
Rahaim also vowed in the letter to announce in spring 2017 “how we undertake a broader socio-economic analysis of displacement, gentrification and growth with a focus on equity” that he said currently isn’t covered under the California Environmental Quality Act.
It remains to be seen whether Rahaim’s letter will prompt the board to reverse its decision on the 1515 S. Van Ness Avenue development.
At the time of the vote, Supervisor Malia Cohen said The City needs “a sea change” on how it handles development. “Development should not be about displacing people,” Cohen had said.
Mission advocates have been working with the Planning Department and other city agencies for more than a year to develop anti-gentrification plans like MAP 2020.
“We are encouraged by the director’s public acknowledgement of the gentrification problem facing the Mission and other neighborhoods of color,” Weaver told the San Francisco Examiner on Monday. “The political will to take the steps necessary to address this problem now lies squarely with the Board of Supervisors and the mayor.”
Tuesday, January 2, 2018
After a busy 2017, Jerry Brown and Senator Wiener have a year of surprising new taxes that will screw us.

Rust never sleeps. The Housing Radicals in Sacramento, supported by Marin's Senator Mike McGuire and Assemblyman Marc Levine passed a huge package of housing laws that will force development in Marinwood and Marin County. Apparently, they want to make single family home suburbs illegal. The developers and the financial community are ecstatic.
See the California League of Cities reports on Housing Law Changes HERE
Monday, January 1, 2018
Sunday, December 31, 2017
Why politicians love cities

Glenn Reynolds: Why politicians love cities
Glenn Harlan Reynolds 4:02 AM. EST June 21, 2016The 20th century French architect Le Corbusier, famous for his huge, inhuman structures, dedicated his first book To Authority. Too many of his successors seem to feel the same way. Now, in his new book The Human City: Urbanism For The Rest Of Us, Joel Kotkin says there’s a better way.
Today’s urban planners seem to favor high density. Like Le Corbusier, they’d like people to live in tall, densely packed buildings, take mass transit to work, and scorn the “fatter and slower and dumber” residents of the suburb, to use a description from Seattle’s The Stranger that Kotkin quotes.
The problem is that most people, especially people who have or want to have children, don’t like living that way, and that as American cities have become taller and denser, they have essentially become playgrounds for the rich and childless. “For all their impressive achievements, and sometimes inspiring architecture, high-density cores such as those in Manhattan, Seattle, San Francisco, Boston and Washington, D.C., have the lowest percentages of children,” Kotkin says in his new book.
And it’s not just in America. Kotkin says big Asian cities have the lowest fertility rates on the planet, and in Hong Kong, 45% of couples say they’ve given up on having children. Yet politicians love these cities.
As Kotkin writes, “Around the world, planners, politicians and pundits often wax poetic about these massive new building projects and soaring residences made up of hundreds of tiny stacked units, but there’s just one problem with this brave new condensed world: Most people, including many inner-city residents, aren’t crazy about it. People care deeply about where they live, and they often aren’t thrilled with the kind of urban vision held by many city leaders.”
So if people are lukewarm, why are politicians so enthusiastic about big urban development? I think there are three reasons: Snobbery, graft and politics.
The snobbery comes from the fact that most media are headquartered in big cities and the people who work there are the kind of people who like big cities — often people who, as one of Taylor Swift’s songs has it, move to a “big ole city” in part as revenge on the places they come from. As Kotkin notes, the writers, pundits and academic types who write on the subject of cities tend to live in big cities; suburban and rural people are treated as losers, or just ignored, despite the fact that most people don’t live in big cities. And there’s a class thing going on, too. As Robert Bruegmann noted in his book, Sprawl: A Compact History, nobody minds when rich people build houses in the country. It’s when the middle class does it that we get complaints.
The graft is probably more important still: Big developments mean lots of permissions, many regulatory interactions and, of course, big budgets — all of which lend themselves to facilitating the transfer of money from developers to politicians. Frequently they’re government subsidized, which allows that money to come, ultimately but almost invisibly, from the pockets of taxpayers.
(This is also why politicians like subways and light rail better than buses. You can reward a developer over the long term by putting a rail station near a development, which makes it a proper object for graft. Bus routes, on the other hand, can change overnight, so they’re not worth as much.)
Finally, there’s politics. Politicians like to pursue policies that encourage their political enemies to leave, while encouraging those who remain to vote for them. (This is known as “the Curley effect” after James Michael Curley, a former mayor of Boston.) People who have children, or plan to, tend to be more conservative, or at least more bourgeois, than those who do not. By encouraging high density and mass transit, urban politicians (who are almost always on the left) encourage people who might oppose them to “vote with their feet” and move to the suburbs.
This isn’t necessarily good for the cities they rule. Curley’s approach, which involved “wasteful redistribution to his poor Irish constituents and incendiary rhetoric to encourage richer citizens to emigrate from Boston,” as David Henderson wrote on the EconLog, shaped the electorate to his benefit. Result: “Boston as a consequence stagnated, but Curley kept winning elections.”
But that’s OK. Politicians don’t care about you. They care about power, in urban planning and in everything else.
Glenn Harlan Reynolds, a University of Tennessee law professor and the author of The New School: How the Information Age Will Save American Education from Itself, is a member of USA TODAY's Board of Contributors.
Saturday, December 30, 2017
"Housing Crisis" or bubble ?? California Net Migration -556,710
"Housing Crisis" or bubble ??
California Net Migration -556,710
"The latest population estimates indicate that the long-term movement to the South and West is continuing. Of course, the biggest exception in the West remains its largest state, California, which has become one of the nation's largest exporters of people since the 1990s."
http://www.newgeography.com/content/005837-the-migration-millions-2017-state-population-estimates
by Wendell Cox 12/30/2017

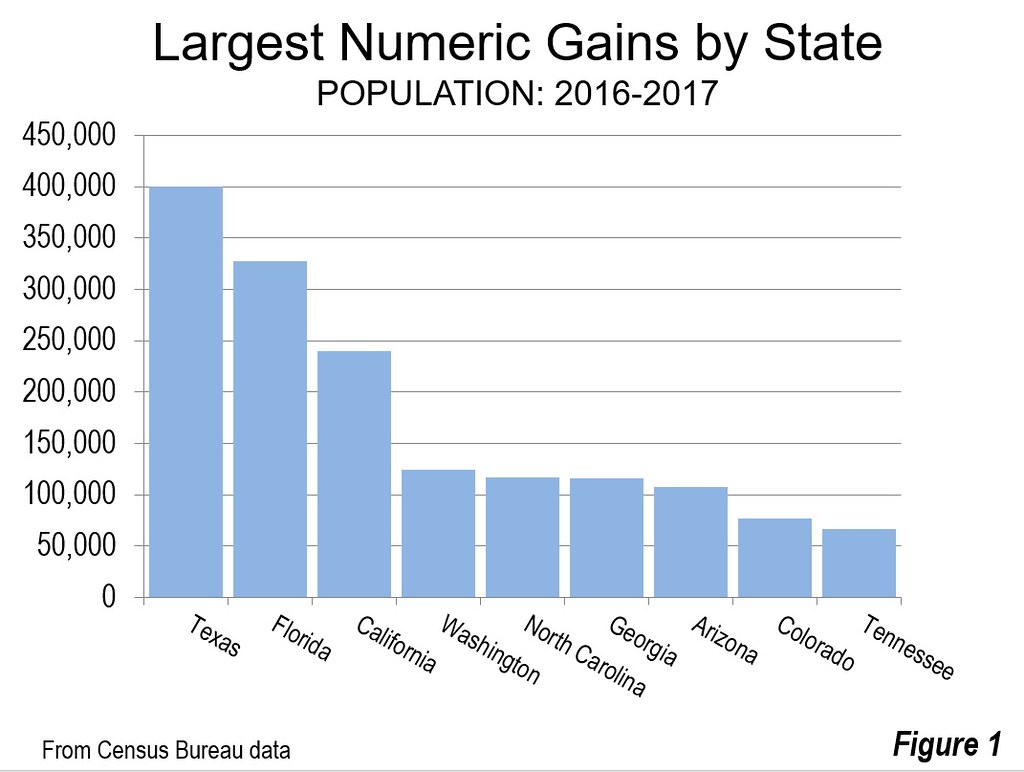
Texas added the most new residents of any state over the past year according to the July 1, 2017 estimates of the United States Census Bureau. Texas grew by 400,000 residents (Figure 1). Florida added 328,000 residents more than one third more than California. Four states grew between 100,000 to 125,000, led by Washington, North Carolina, Georgia and Arizona. Colorado and Tennessee round out the top 10. The ten states adding the most new residents include five from the South census region and five from the West census region.
Population Growth
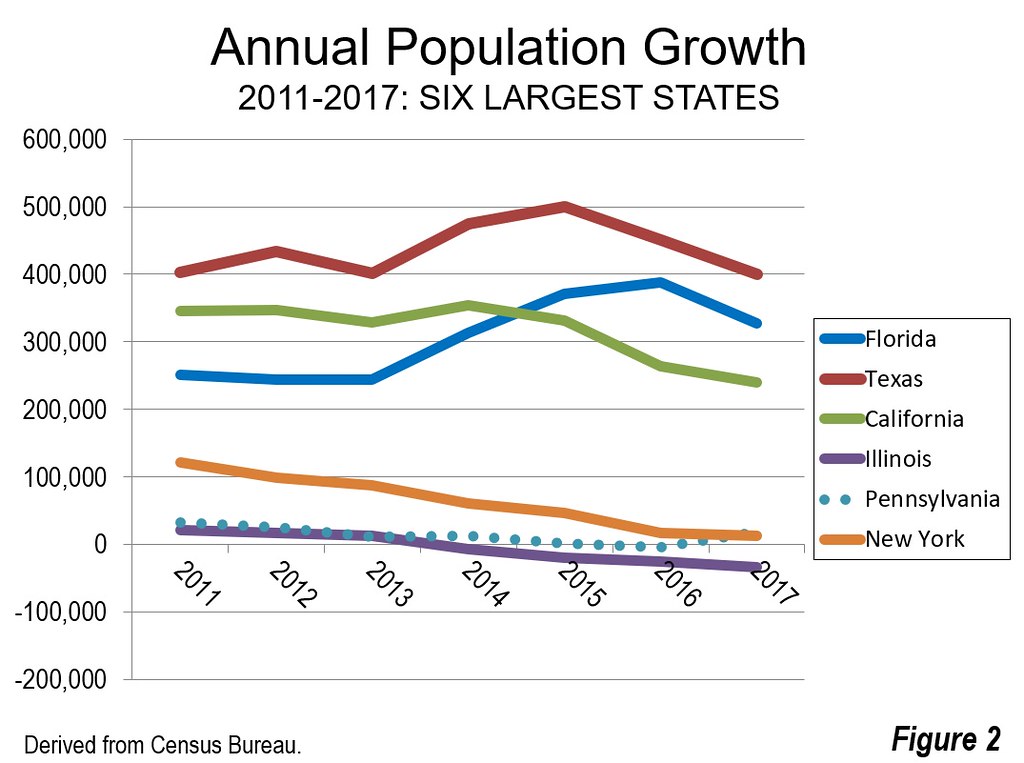
Over this decade, the three largest states have dominated numeric population growth. Texas has led the nation in each of the seven years, though has experienced declines in growth over the last two due likely to the instability in petroleum markets. Since 2010, Texas has added 3.1 million residents, more than live in 18 states and the District of Columbia. California has added 2.2 million new residents since 2010, edging out Florida. California's growth, however, has dropped significantly, to 240,000 between 2016 and 2017 the smallest number since the late 1990s. California's growth in this decade had peaked in 2014 at more than 350,000, but has since dropped by nearly one quarter. Florida added 2.1 million new residents and has led California in each of the last three years.
The other three largest states did much more poorly. New York has dropped from a gain of over 120,000 in 2011 to only 13,000 in 2017. Illinois has done even more poorly, dropping from the 21,000 gain in 2011 to a loss of 33,000 in 2017. Illinois has experienced a reduction in its growth each year of this decade.
Illinois Drops a Notch: Further, Illinois in 2017 lost its long standing hold on the fifth-largest position to Pennsylvania. Pennsylvania's ascendancy reverses a development in the 1950s, when Illinois passed Pennsylvania to become the third largest state. Less than a decade earlier, Pennsylvania had been passed by California, relinquishing its second ranking, which it had held since the 1810 census. Later, Illinois had been passed in the 1970s by Texas and in the following decade by Florida. (Figure 2).
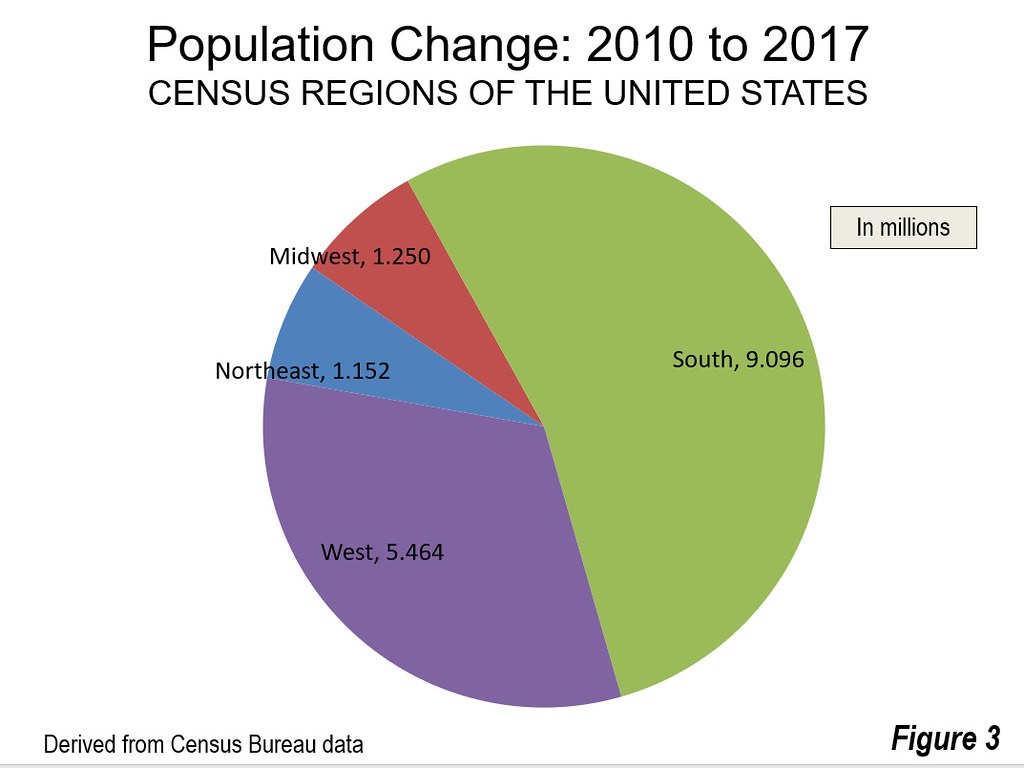
The South census region has dominated US population growth throughout the decade. Between 2010 and 2017, the South added 9.1 million new residents or 54% of the national growth. This compares to the West, which also grew strongly but added millions fewer (5.5 million new residents). The West accounted for 32% of the national growth. The Midwest and Northeast continue to lag, each taking 7% of the national growth (Figure 3).
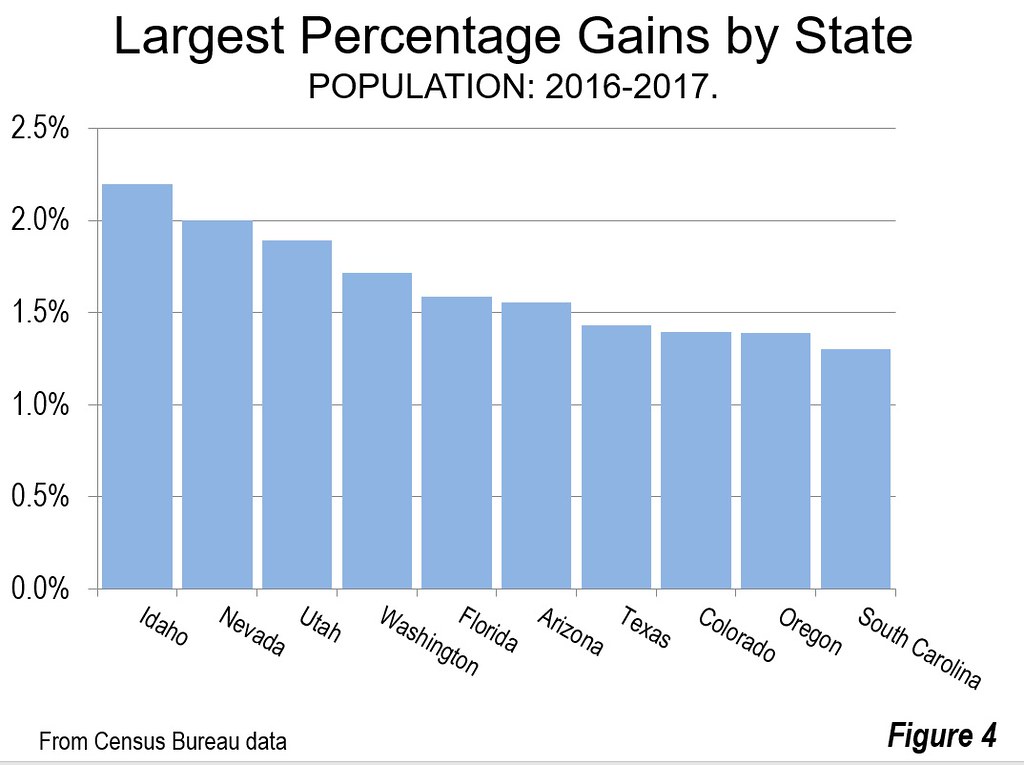
Idaho experienced the largest proportional growth rate in 2007, at 2.2%. Idaho was followed closely by its neighbors, Nevada at 2.0% and Utah at 1.9%. The next four positions were taken by large or medium sized states, including Washington at 1.7%, Florida and Arizona at 1.6% and Texas at 1.4%. Colorado and Oregon grew at 1.4%, followed by South Carolina at 1.3% (Figure 4).
Where the Millions are Moving
Despite the fact that interstate migration stands at a lower rate than in recent decades, millions of people continue to cross state lines seeking new residences. From 2010 to 2017, the number was 4.3 million. Domestic migration has been dominated by the South and West census regions, consistent with their dominance of population growth.
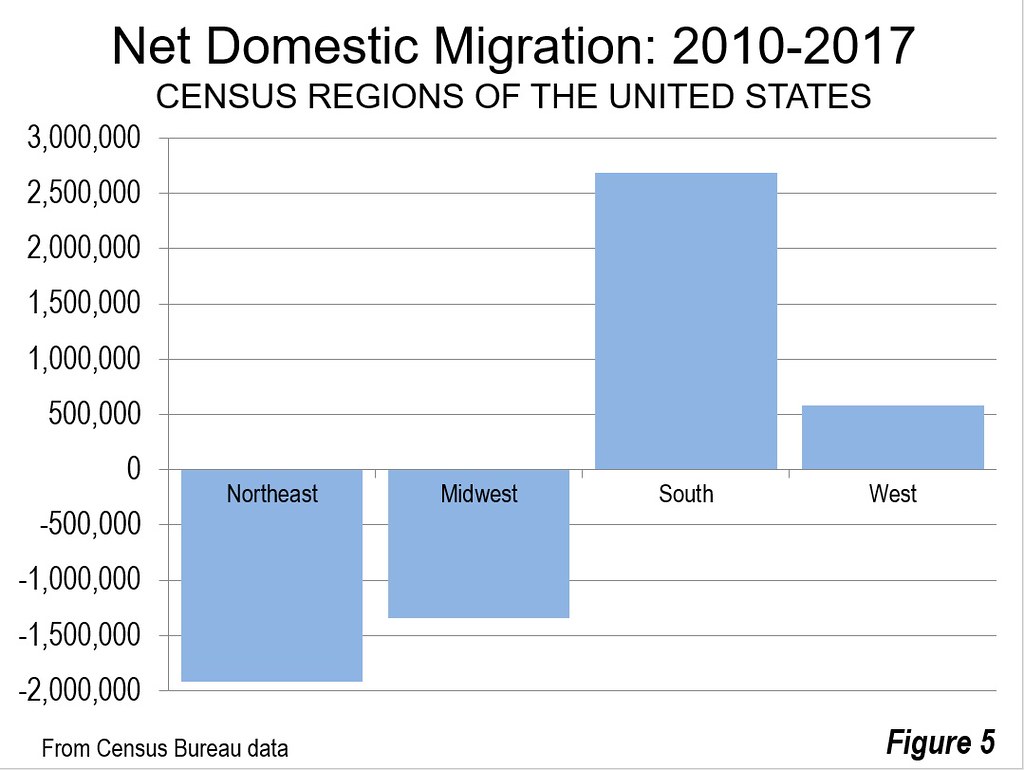
The South census region had a net domestic migration gain of 2.7 million residents. The West census region had a gain of 600,000 net domestic migrants, far short of the number in the South. In contrast, a net 1.9 million residents left the Northeast for other census regions, while 1.3 million left the Midwest for elsewhere (Figure 5). Even so, as indicated above, the Northeast and Midwest continue to grow as a result of in migration from other countries and natural growth (births minus deaths).
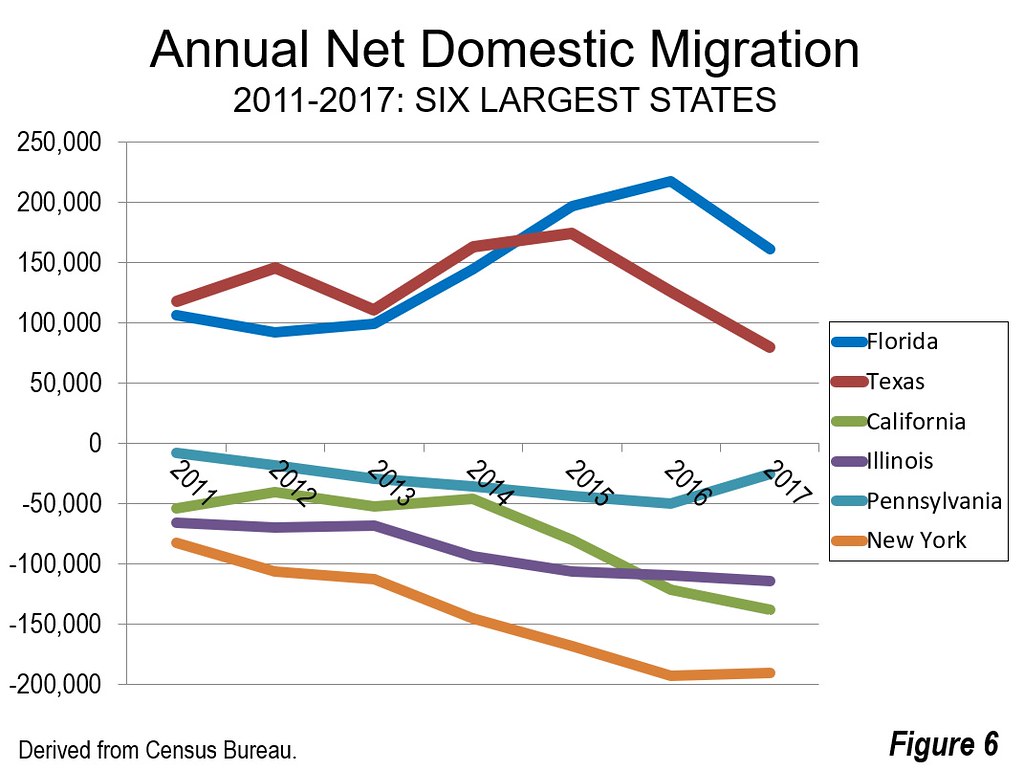
The six largest states experienced significantly different net domestic migration results. Florida has led in net domestic migration, adding 1.025 million residents from other states since 2010. Florida has also led in three of the seven years. Texas led in the first four years of the decade and has added 945,000 net domestic migrants.
Among the other four largest states, the net domestic migration losses have been substantial. The smallest loss has been in Pennsylvania at approximately 215,000. California has lost approximately 545,000 net domestic migrants since 2010, a pattern that has accelerated in recent years. Just three years ago (2014), California had lost fewer than 50,000 net domestic migrants. By 2017, outward net migration had escalated to nearly 140,000. In the first five years of the decade, California had done less poorly in net domestic migration than Illinois. However, in each of the last two years, California has lost more net domestic migrants than Illinois.
Illinois has lost the second largest number of net domestic migrants, at more than 640,000. The losses have escalated from below 75,000 in each of the first three years of the decade to nearly 115,000 in 2017. New York hemorrhaged by far the largest number of net domestic migrants, more than 1,020,000. In each of the last two years, New York has lost approximately 190,000 net domestic migrants, well above its early 80,000 loss in 2011. (Figure 6).
Dominance of the South (and West)
The latest population estimates indicate that the long-term movement to the South and West is continuing. Of course, the biggest exception in the West remains its largest state, California, which has become one of the nation's largest exporters of people since the 1990s. In contrast, Arizona, Washington, Colorado, Oregon, Nevada have attracted large numbers of people. In the South, most states have been gaining domestic migrants, though there are exceptions, especially Maryland, Virginia, West Virginia and Mississippi. But overall the South has been dominant. In each of the last seven years, the South has been the destination for more than 70 percent of US net domestic migration.
The data is summarized in the Table below.
State Population Estimates
2010 - 2017
State & DC April 1, 2010 July 1, 2017 Change % Net Domestic Migration
Alabama 4,785,579 4,874,747 89,168 1.9% 1,153
Alaska 714,015 739,795 25,780 3.6% -37,492
Arizona 6,407,002 7,016,270 609,268 9.5% 278,290
Arkansas 2,921,737 3,004,279 82,542 2.8% 7,222
California 37,327,690 39,536,653 2,208,963 5.9% -556,710
Colorado 5,048,029 5,607,154 559,125 11.1% 276,485
Connecticut 3,580,171 3,588,184 8,013 0.2% -153,276
Delaware 899,712 961,939 62,227 6.9% 25,824
District of Columbia 605,040 693,972 88,932 14.7% 30,787
Florida 18,846,461 20,984,400 2,137,939 11.3% 1,025,261
Georgia 9,712,696 10,429,379 716,683 7.4% 163,536
Hawaii 1,363,817 1,427,538 63,721 4.7% -42,456
Idaho 1,570,912 1,716,943 146,031 9.3% 61,332
Illinois 12,841,196 12,802,023 -39,173 -0.3% -642,821
Indiana 6,490,029 6,666,818 176,789 2.7% -57,864
Iowa 3,050,223 3,145,711 95,488 3.1% -17,695
Kansas 2,858,403 2,913,123 54,720 1.9% -83,158
Kentucky 4,347,948 4,454,189 106,241 2.4% -12,593
Louisiana 4,544,871 4,684,333 139,462 3.1% -47,701
Maine 1,327,568 1,335,907 8,339 0.6% 3,968
Maryland 5,788,099 6,052,177 264,078 4.6% -112,092
Massachusetts 6,564,943 6,859,819 294,876 4.5% -98,948
Michigan 9,876,731 9,962,311 85,580 0.9% -225,302
Minnesota 5,310,711 5,576,606 265,895 5.0% -32,518
Mississippi 2,970,437 2,984,100 13,663 0.5% -59,667
Missouri 5,995,681 6,113,532 117,851 2.0% -57,375
Montana 990,507 1,050,493 59,986 6.1% 37,304
Nebraska 1,829,956 1,920,076 90,120 4.9% -12,289
Nevada 2,702,797 2,998,039 295,242 10.9% 145,131
New Hampshire 1,316,700 1,342,795 26,095 2.0% 2,875
New Jersey 8,803,708 9,005,644 201,936 2.3% -395,160
New Mexico 2,064,607 2,088,070 23,463 1.1% -55,903
New York 19,405,185 19,849,399 444,214 2.3% -1,022,071
North Carolina 9,574,247 10,273,419 699,172 7.3% 327,631
North Dakota 674,518 755,393 80,875 12.0% 39,178
Ohio 11,539,282 11,658,609 119,327 1.0% -192,615
Oklahoma 3,759,529 3,930,864 171,335 4.6% 28,125
Oregon 3,837,073 4,142,776 305,703 8.0% 181,252
Pennsylvania 12,711,063 12,805,537 94,474 0.7% -214,426
Rhode Island 1,053,169 1,059,639 6,470 0.6% -33,615
South Carolina 4,635,834 5,024,369 388,535 8.4% 264,781
South Dakota 816,227 869,666 53,439 6.5% 11,890
Tennessee 6,355,882 6,715,984 360,102 5.7% 178,125
Texas 25,241,648 28,304,596 3,062,948 12.1% 944,018
Utah 2,775,260 3,101,833 326,573 11.8% 50,162
Vermont 625,842 623,657 -2,185 -0.3% -10,179
Virginia 8,025,206 8,470,020 444,814 5.5% -53,500
Washington 6,741,386 7,405,743 664,357 9.9% 249,052
West Virginia 1,854,315 1,815,857 -38,458 -2.1% -28,380
Wisconsin 5,690,403 5,795,483 105,080 1.8% -68,738
Wyoming 564,376 579,315 14,939 2.6% -8,838
Source: U.S. Census Bureau
Wendell Cox is principal of Demographia, an international public policy and demographics firm. He is a Senior Fellow of the Center for Opportunity Urbanism (US), Senior Fellow for Housing Affordability and Municipal Policy for the Frontier Centre for Public Policy (Canada), and a member of the Board of Advisors of the Center for Demographics and Policy at Chapman University (California). He is co-author of the "Demographia International Housing Affordability Survey" and author of "Demographia World Urban Areas" and "War on the Dream: How Anti-Sprawl Policy Threatens the Quality of Life." He was appointed to three terms on the Los Angeles County Transportation Commission, where he served with the leading city and county leadership as the only non-elected member. He served as a visiting professor at the Conservatoire National des Arts et Metiers, a national university in Paris.
California Net Migration -556,710
"The latest population estimates indicate that the long-term movement to the South and West is continuing. Of course, the biggest exception in the West remains its largest state, California, which has become one of the nation's largest exporters of people since the 1990s."
http://www.newgeography.com/content/005837-the-migration-millions-2017-state-population-estimates
THE MIGRATION OF MILLIONS: 2017 STATE POPULATION ESTIMATES
by Wendell Cox 12/30/2017
Texas added the most new residents of any state over the past year according to the July 1, 2017 estimates of the United States Census Bureau. Texas grew by 400,000 residents (Figure 1). Florida added 328,000 residents more than one third more than California. Four states grew between 100,000 to 125,000, led by Washington, North Carolina, Georgia and Arizona. Colorado and Tennessee round out the top 10. The ten states adding the most new residents include five from the South census region and five from the West census region.
Population Growth
Over this decade, the three largest states have dominated numeric population growth. Texas has led the nation in each of the seven years, though has experienced declines in growth over the last two due likely to the instability in petroleum markets. Since 2010, Texas has added 3.1 million residents, more than live in 18 states and the District of Columbia. California has added 2.2 million new residents since 2010, edging out Florida. California's growth, however, has dropped significantly, to 240,000 between 2016 and 2017 the smallest number since the late 1990s. California's growth in this decade had peaked in 2014 at more than 350,000, but has since dropped by nearly one quarter. Florida added 2.1 million new residents and has led California in each of the last three years.
The other three largest states did much more poorly. New York has dropped from a gain of over 120,000 in 2011 to only 13,000 in 2017. Illinois has done even more poorly, dropping from the 21,000 gain in 2011 to a loss of 33,000 in 2017. Illinois has experienced a reduction in its growth each year of this decade.
Illinois Drops a Notch: Further, Illinois in 2017 lost its long standing hold on the fifth-largest position to Pennsylvania. Pennsylvania's ascendancy reverses a development in the 1950s, when Illinois passed Pennsylvania to become the third largest state. Less than a decade earlier, Pennsylvania had been passed by California, relinquishing its second ranking, which it had held since the 1810 census. Later, Illinois had been passed in the 1970s by Texas and in the following decade by Florida. (Figure 2).
The South census region has dominated US population growth throughout the decade. Between 2010 and 2017, the South added 9.1 million new residents or 54% of the national growth. This compares to the West, which also grew strongly but added millions fewer (5.5 million new residents). The West accounted for 32% of the national growth. The Midwest and Northeast continue to lag, each taking 7% of the national growth (Figure 3).
Idaho experienced the largest proportional growth rate in 2007, at 2.2%. Idaho was followed closely by its neighbors, Nevada at 2.0% and Utah at 1.9%. The next four positions were taken by large or medium sized states, including Washington at 1.7%, Florida and Arizona at 1.6% and Texas at 1.4%. Colorado and Oregon grew at 1.4%, followed by South Carolina at 1.3% (Figure 4).
Where the Millions are Moving
Despite the fact that interstate migration stands at a lower rate than in recent decades, millions of people continue to cross state lines seeking new residences. From 2010 to 2017, the number was 4.3 million. Domestic migration has been dominated by the South and West census regions, consistent with their dominance of population growth.
The South census region had a net domestic migration gain of 2.7 million residents. The West census region had a gain of 600,000 net domestic migrants, far short of the number in the South. In contrast, a net 1.9 million residents left the Northeast for other census regions, while 1.3 million left the Midwest for elsewhere (Figure 5). Even so, as indicated above, the Northeast and Midwest continue to grow as a result of in migration from other countries and natural growth (births minus deaths).
The six largest states experienced significantly different net domestic migration results. Florida has led in net domestic migration, adding 1.025 million residents from other states since 2010. Florida has also led in three of the seven years. Texas led in the first four years of the decade and has added 945,000 net domestic migrants.
Among the other four largest states, the net domestic migration losses have been substantial. The smallest loss has been in Pennsylvania at approximately 215,000. California has lost approximately 545,000 net domestic migrants since 2010, a pattern that has accelerated in recent years. Just three years ago (2014), California had lost fewer than 50,000 net domestic migrants. By 2017, outward net migration had escalated to nearly 140,000. In the first five years of the decade, California had done less poorly in net domestic migration than Illinois. However, in each of the last two years, California has lost more net domestic migrants than Illinois.
Illinois has lost the second largest number of net domestic migrants, at more than 640,000. The losses have escalated from below 75,000 in each of the first three years of the decade to nearly 115,000 in 2017. New York hemorrhaged by far the largest number of net domestic migrants, more than 1,020,000. In each of the last two years, New York has lost approximately 190,000 net domestic migrants, well above its early 80,000 loss in 2011. (Figure 6).
Dominance of the South (and West)
The latest population estimates indicate that the long-term movement to the South and West is continuing. Of course, the biggest exception in the West remains its largest state, California, which has become one of the nation's largest exporters of people since the 1990s. In contrast, Arizona, Washington, Colorado, Oregon, Nevada have attracted large numbers of people. In the South, most states have been gaining domestic migrants, though there are exceptions, especially Maryland, Virginia, West Virginia and Mississippi. But overall the South has been dominant. In each of the last seven years, the South has been the destination for more than 70 percent of US net domestic migration.
The data is summarized in the Table below.
State Population Estimates
2010 - 2017
State & DC April 1, 2010 July 1, 2017 Change % Net Domestic Migration
Alabama 4,785,579 4,874,747 89,168 1.9% 1,153
Alaska 714,015 739,795 25,780 3.6% -37,492
Arizona 6,407,002 7,016,270 609,268 9.5% 278,290
Arkansas 2,921,737 3,004,279 82,542 2.8% 7,222
California 37,327,690 39,536,653 2,208,963 5.9% -556,710
Colorado 5,048,029 5,607,154 559,125 11.1% 276,485
Connecticut 3,580,171 3,588,184 8,013 0.2% -153,276
Delaware 899,712 961,939 62,227 6.9% 25,824
District of Columbia 605,040 693,972 88,932 14.7% 30,787
Florida 18,846,461 20,984,400 2,137,939 11.3% 1,025,261
Georgia 9,712,696 10,429,379 716,683 7.4% 163,536
Hawaii 1,363,817 1,427,538 63,721 4.7% -42,456
Idaho 1,570,912 1,716,943 146,031 9.3% 61,332
Illinois 12,841,196 12,802,023 -39,173 -0.3% -642,821
Indiana 6,490,029 6,666,818 176,789 2.7% -57,864
Iowa 3,050,223 3,145,711 95,488 3.1% -17,695
Kansas 2,858,403 2,913,123 54,720 1.9% -83,158
Kentucky 4,347,948 4,454,189 106,241 2.4% -12,593
Louisiana 4,544,871 4,684,333 139,462 3.1% -47,701
Maine 1,327,568 1,335,907 8,339 0.6% 3,968
Maryland 5,788,099 6,052,177 264,078 4.6% -112,092
Massachusetts 6,564,943 6,859,819 294,876 4.5% -98,948
Michigan 9,876,731 9,962,311 85,580 0.9% -225,302
Minnesota 5,310,711 5,576,606 265,895 5.0% -32,518
Mississippi 2,970,437 2,984,100 13,663 0.5% -59,667
Missouri 5,995,681 6,113,532 117,851 2.0% -57,375
Montana 990,507 1,050,493 59,986 6.1% 37,304
Nebraska 1,829,956 1,920,076 90,120 4.9% -12,289
Nevada 2,702,797 2,998,039 295,242 10.9% 145,131
New Hampshire 1,316,700 1,342,795 26,095 2.0% 2,875
New Jersey 8,803,708 9,005,644 201,936 2.3% -395,160
New Mexico 2,064,607 2,088,070 23,463 1.1% -55,903
New York 19,405,185 19,849,399 444,214 2.3% -1,022,071
North Carolina 9,574,247 10,273,419 699,172 7.3% 327,631
North Dakota 674,518 755,393 80,875 12.0% 39,178
Ohio 11,539,282 11,658,609 119,327 1.0% -192,615
Oklahoma 3,759,529 3,930,864 171,335 4.6% 28,125
Oregon 3,837,073 4,142,776 305,703 8.0% 181,252
Pennsylvania 12,711,063 12,805,537 94,474 0.7% -214,426
Rhode Island 1,053,169 1,059,639 6,470 0.6% -33,615
South Carolina 4,635,834 5,024,369 388,535 8.4% 264,781
South Dakota 816,227 869,666 53,439 6.5% 11,890
Tennessee 6,355,882 6,715,984 360,102 5.7% 178,125
Texas 25,241,648 28,304,596 3,062,948 12.1% 944,018
Utah 2,775,260 3,101,833 326,573 11.8% 50,162
Vermont 625,842 623,657 -2,185 -0.3% -10,179
Virginia 8,025,206 8,470,020 444,814 5.5% -53,500
Washington 6,741,386 7,405,743 664,357 9.9% 249,052
West Virginia 1,854,315 1,815,857 -38,458 -2.1% -28,380
Wisconsin 5,690,403 5,795,483 105,080 1.8% -68,738
Wyoming 564,376 579,315 14,939 2.6% -8,838
Source: U.S. Census Bureau
Wendell Cox is principal of Demographia, an international public policy and demographics firm. He is a Senior Fellow of the Center for Opportunity Urbanism (US), Senior Fellow for Housing Affordability and Municipal Policy for the Frontier Centre for Public Policy (Canada), and a member of the Board of Advisors of the Center for Demographics and Policy at Chapman University (California). He is co-author of the "Demographia International Housing Affordability Survey" and author of "Demographia World Urban Areas" and "War on the Dream: How Anti-Sprawl Policy Threatens the Quality of Life." He was appointed to three terms on the Los Angeles County Transportation Commission, where he served with the leading city and county leadership as the only non-elected member. He served as a visiting professor at the Conservatoire National des Arts et Metiers, a national university in Paris.
NYC Woman Shows Her Loft Apartment That She Has Lived in for 29 Years
Urban YIMBYs can learn from the experience of New Yorkers. There is no FREE LUNCH. Gentrifiers push out minorities, artists and the middle class. Only the rich and the resilient remain.
Friday, December 29, 2017
California officials say housing next to freeways is a health risk — but they fund it anyway
California officials say housing next to freeways is a health risk — but they fund it anyway
By TONY BARBOZA and DAVID ZAHNISER
DEC 17, 2017 | 5:00 AM
 Traffic flows on the I-5 near the Sheldon Street exit where an empty lot is a possible site for a homeless veterans housing complex in Sun Valley on December 12, 2017. (Genaro Molina / Los Angeles Times)
It’s the type of project Los Angeles desperately needs in a housing crisis: low-cost apartments for seniors, all of them veterans, many of them homeless.
There’s just one downside. Wedged next to an offramp, the four-story building will stand 200 feet from the 5 Freeway.
State officials have for years warned against building homes within 500 feet of freeways, where people suffer higher rates of asthma, heart disease, cancer and other health problems linked to car and truck pollution. Yet they’re helping build the 96-unit complex, providing $11.1 million in climate change funds from California’s cap-and-trade program.
The Sun Valley Senior Veterans Apartments is one of at least 10 affordable housing projects within 500 feet of a freeway awarded a total of $65 million in cap-and-trade money since 2015, a Times review of records found. Those developments will place hundreds of apartments for homeless people, veterans and families near freeways in Los Angeles, the Bay Area and the Central Valley, some less than 100 feet from traffic.
California’s support for those projects shows how policies created to cut greenhouse gases and ease the housing crunch are also putting some of the state’s neediest residents at risk from traffic pollution. It's one way public dollars are helping finance a surge in residential development near freeways, where Los Angeles and other California cities have permitted thousands of new homes in recent years.
How close do you live to the freeway? »
State officials acknowledge that some cap-and-trade money, collected from companies that buy permits to emit greenhouse gases, will put residents near elevated levels of pollution. But they say dense housing near bus and rail lines is crucial to meeting California’s climate goals, by getting cars off the road.
Even in places with poor air quality, they argue, residents’ health will improve from walking and biking more. And they say the dangers from living near freeways can be reduced with anti-pollution design features recommended this year by state air regulators, including sound walls, vegetation barriers and high-efficiency air filters that remove some of the harmful particles from vehicle exhaust.
“When those strategies are employed, the environmental and public health benefits of these projects far outweigh the negatives,” said Ken Alex, a senior advisor to Gov. Jerry Brown who chairs the Strategic Growth Council, the agency that distributes cap-and-trade funds to affordable housing developers.
California’s decision to subsidize low-income housing near freeways alarms some health scientists, who point to years of studies that link roadway pollution with a growing list of illnesses — and billions in healthcare costs. They say air filters and other mitigation measures are not enough to protect residents, especially children, whose lungs could be damaged for life, and seniors, who could die early from heart attacks.
“I see the economic incentives for doing this,” said Beate Ritz, an environmental epidemiologist at UCLA who has studied the health effects of traffic pollution for more than two decades. “But it’s kind of stupid, because we all know we will pay for it with long-term health effects. Somebody has to pay for the costs of diabetes, of cognitive decline or strokes. This is just creating a huge amount of costs for society in the long run.”
Construction is expected to start within weeks on the Sun Valley project, capping a decade of debate that pitted the need for more housing against the health of people who would live there. Proponents say those apartments will be far superior to life on the street, with higher-rated air filters and a buffer — dozens of trees, a sound wall and a parking lot — separating residents from pollution.
Despite those measures, some locals argue the freeway is simply too close.
“These vets are going to be sucking in these diesel fumes. It’s going to shorten their lives,” said Mike O’Gara, who lives eight blocks away and is a veteran of the U.S. Naval Air Forces. “What a hell of a great reward for serving their country.”
Unpleasant choices
The Sun Valley project offers a window into the unpleasant choices faced by politicians, real estate developers and nonprofit groups as they struggle to counter rising rents and a surge in homelessness, which grew 23% this year across Los Angeles County, to nearly 58,000 people.
Los Angeles, a city crisscrossed by freeways, is embarking on a $1.2-billion plan aimed at financing 10,000 homes for homeless people. Land next to those corridors — often cheaper and less likely to spur outcry from neighborhood groups — will be tempting to build on.
If policymakers put low-cost housing next to freeways, they will place some of their poorest constituents in locations where pollution can be five to 10 times higher, saddling them with the health consequences. But if they prohibit new construction in those areas, they could make things tougher for people trying to get off, or stay off, the streets.
Of the roughly 2,000 affordable housing units approved in Los Angeles in 2016, 1 in 4 was within 1,000 feet of a freeway, according to figures from the Department of City Planning. Officials are weighing whether to build homeless housing on at least nine city-owned properties within 500 feet of freeways — including one that’s less than 200 feet from the sprawling 110-105 freeway interchange.
Housing advocates point to studies that link homelessness to early deaths from drug use, respiratory disorders and other health problems. Homeless individuals are also less likely to obtain access to healthcare, mental health services and substance abuse counseling than those who have shelter, said Mike Alvidrez, chief executive of Skid Row Housing Trust, which has built 1,800 units of housing since 1989 — including one building next to the 10 Freeway.
“We know that people die sooner if they don’t get off the street and into housing. We just know that,” he said. “So if you have a solution that going to prolong someone’s life — irrespective of whether it’s the worst place you could put it, next to a freeway or next to two freeways — if you don’t have another option, that’s what you do.”
Across the region, homeless people are already living near freeways — in tents tucked along sound walls, in campsites obscured by shrubbery. Jason McKenney, 34, said he has spent some nights in North Hollywood Park, which runs along the 170 Freeway.
Sitting under a tree nursing an injured leg, the onetime construction worker said he would have no qualms about moving into a building next to a freeway, if it had cheap rents and counseling for substance abuse.
“I would jump at that chance,” he said.
Apartments near transit
With climate change now a top priority, California has embraced policies to cut carbon emissions by packing dense housing near jobs and transit. State leaders have set aside nearly $700 million from the cap-and-trade program to finance transit-oriented developments and infrastructure.
The planned Sun Valley development is on a noisy stretch of Laurel Canyon Boulevard with high-speed traffic and few walkable businesses. But because it’s near a bus stop, the project was eligible for cap-and-trade funds.
To boost transit use near the senior housing complex, a portion of those funds will go toward free bus and rail passes for the tenants, as well as new crosswalks, sidewalks and wheelchair ramps.
Like many projects that have received cap-and-trade money, the project is in a location that already endures a heavy pollution burden, which helped it qualify for state funds. The application for cap-and-trade money acknowledged the neighborhood has high rates of asthma.
Some in the neighborhood, such as 75-year-old Joan Winget, see the freeway as a serious health threat. Diagnosed with emphysema in 2012, Winget has lived more than 20 years in a mobile home park right next to the senior housing site.
The retired property manager smoked cigarettes until 1979, and her health issues are linked at least in part to that habit. But she worries her medical problems have been exacerbated by pollution from the nearby 5-170 freeway interchange, whose swooping ramps can be seen from the property’s driveway.
Each day, about 200,000 vehicles on the 5 pass her home. To protect herself, Winget keeps her doors and windows closed 24/7 and the air conditioning running around the clock. She misses the days when she let a breeze blow through her home late at night.
“I hate it,” she said. “I love fresh air. I like getting outside. I don’t like being stuck in the house all the time. I might not be getting the greatest air in here, but it’s worse outside.”
Regulators say decades of tough clean-air rules have slashed tailpipe emissions, reducing risks to people near freeways. But some scientists warn those health improvements will be undercut by the state’s push to concentrate high-density housing near transit hubs, which often sit near major roadways.
A 2016 study projected state climate policies would increase the number of preventable deaths from heart disease in Southern California by placing more people near traffic pollution. Establishing buffers between homes and heavy traffic, in contrast, would decrease heart disease deaths, especially among the elderly, according to the study by researchers from USC, the California Department of Public Health and several other institutions.
The state Air Resources Board — which since 2005 has recommended municipalities “avoid siting” homes within 500 feet of freeways — oversees the spending of billions of dollars in cap-and-trade funds by a dozen state agencies. But the board does not select the affordable housing projects that get the money. Those decisions rest with the Strategic Growth Council, a committee appointed by the governor and state lawmakers.
Records show the Strategic Growth Council voted unanimously to award funds for apartments next to the 110 Freeway in Los Angeles, housing along Highway 99 in Turlock and a 135-unit building in San Jose that’s just 25 feet from Highway 87, a location a state analysis ranks in the 95th percentile for diesel emissions.
At least one member of the panel, Manuel Pastor, said he was unaware he had voted for housing so close to freeways.
Pastor, who directs USC’s Program for Environmental and Regional Equity and has written on the health implications of building near roadway pollution, said the issue never came up when the projects were being considered.
“Your pointing out the exact location of these projects is the first time it has come to my attention,” said Pastor, an appointee of State Senate leader Kevin de León. “I have not until now asked for a map of where these things are.”
‘Poor planning and bad zoning’
The push to build homes on the Sun Valley site began more than a decade ago, just as Los Angeles city officials were starting to reckon with the health risks posed by freeway-adjacent development.
Initially, the zoning for the site allowed for just three homes. The City Council hiked that number to 26 in 2008, at the request of the property’s owners. Three years later, the same developers asked the city to increase the number again, taking it to 96.
Each step of the way, there were warnings about freeway pollution — first from planning commissioners, then neighbors, and finally the South Coast Air Quality Management District. Early on, one mayoral appointee called it an example of “poor planning and bad zoning.”
But the developers had a champion in U.S. Rep. Tony Cardenas, who represented the area.
Cardenas and two of his allies, then-State Sen. Alex Padilla and then-Assemblyman Raul Bocanegra, urged city leaders in 2013 to allow a 96-unit elder care facility to go up on the site. All three have received a steady stream of political contributions from developers, architects and others who worked on the Sun Valley development — at least $70,350 over the last 15 years, a Times review of donations found.
The elder care project was approved, and in 2015, the owners sold it for $3.5 million, more than three times the amount paid in 2006, when only three homes could be built on the site.
Neither Cardenas nor Bocanegra would comment for this story. Padilla, now California’s secretary of state, said he supported the project because it offered “affordable living options for senior citizens.”
Businessman David Spiegel, one of the project’s developers at the time, said he followed the city’s rules. “There are hundreds of thousands of units that have been and are currently being built on the freeway,” he said, “so any impacts must be acceptable to city, state and federal agencies.”
Sealing windows shut
The property was purchased by the East L.A. Community Corp., a nonprofit housing developer with experience putting low-income housing next to freeways. ELACC, as the group is known, had already built 33 apartments for homeless veterans along the 5 Freeway in Boyle Heights. At that location, windows facing the freeway are sealed shut and the air conditioning system has higher-rated filters.
Isela Gracian, the nonprofit group’s president, said many of L.A.’s low-income neighborhoods were carved up by freeways decades ago. That, she said, makes it difficult to find properties far from car and truck pollution.
“Not every piece of land is available to us,” she said. “Whoever currently owns the land has to be willing and open to selling the property. It’s not like we can walk the streets and say, ‘This is a better location — let’s swap the project and move it over here.’ ”
Still, one agency in Los Angeles County has managed to avoid putting its money into projects along freeways.
The county’s Community Development Commission, which provides tens of millions of dollars in low-interest loans to affordable housing developers each year, decided in 2008 that it would not allow its money to finance projects within 500 feet of a freeway.
Kathy Thomas, who heads the agency, said that decision was made in response to warnings about the health hazards of traffic pollution from the Air Resources Board and other regulators. Yet even with that limitation, the commission finances hundreds of units of housing each year — and receives more requests for money than it has to lend, she said.
“We have not had any difficulty finding projects,” Thomas said in an email. “Our freeway buffer requirement is well-known among developers and we really don’t get any pushback.”
Thomas said it would be “negligent” for her agency to knowingly put low-cost housing next to freeways and undermine the county’s work in reducing “the cost burden of frequent users on the healthcare system.”
Some officials want similar conditions on the spending of cap-and-trade funds.
Dean Florez, a former state senator who sits on the Air Resources Board, said California should stop using cap-and-trade money for housing near freeways. Those projects, he said, “will endanger people’s lungs for decades.”
The Strategic Growth Council is moving ahead without such restrictions as it accepts applications for another $255 million in affordable housing funds.
Agency officials will score projects by proximity to transit, greenhouse gas reductions, walkability and other criteria. One thing they won’t measure is how close the projects are to freeway pollution.
Thursday, December 28, 2017

Subscribe to:
Posts (Atom)