Showing posts with label demographics. Show all posts

Monday, January 7, 2019

A Generation plans an exodus from California

A Generation plans an exodus from California


Is it time to pack up and head East? Some small companies in Southern California are moving logistics operations to Texas and other neighboring states to reduce overhead. (iStockphoto)

By JOEL KOTKIN and WENDELL COX | Orange County Register
PUBLISHED: September 8, 2018 at 5:30 pm | UPDATED: September 10, 2018 at 3:10 pm


California is the great role model for America, particularly if you read the Eastern press. Yet few boosters have yet to confront the fact that the state is continuing to hemorrhage people at a higher rate, with particular losses among the family-formation age demographic critical to California’s future.

Since the recovery began in 2010, California’s net domestic out-migration, according to the American community survey, has almost tripled to 140,000 annually. Over that time, the state has lost half a million net migrants with the bulk of that coming from the Los Angeles-Orange County area.

In contrast, during the first years of the decade the Bay Area, particularly San Francisco, enjoyed a renaissance of in-migration, something not seen since before 2000. But that is changing. A recent Redfin report suggests that the Bay Area, the focal point of California’s boom, now leads the country in outbound home searches, which could suggest a further worsening of the trend.


Who’s leaving?


One of the perennial debates about migration, particularly in California, is the nature of the outmigration. The state’s boosters, and the administration itself, like to talk as if California is simply giving itself an enema — expelling its waste — while making itself an irresistible beacon to the “best and brightest.”

The reality, however, is more complicated than that. An analysis of IRS data from 2015-16, the latest available, shows that while roughly half those leaving the state made under $50,000 annually, half made above that. Roughly one in four made over $100,000 and another quarter earned a middle-class paycheck between $50,000 and $100,000. We also lose among the wealthiest segment, the people best able to withstand California’s costs, but by much smaller percentages.

The key issue for California, however, lies with the exodus of people around child-bearing years. The largest group leaving the state — some 28 percent — is 35 to 44, the prime ages for families. Another third come from those 26 to 34 and 45 to 54, also often the age of parents.


The key: Too expensive housing, not enough high-wage jobs


Our analysis? California is in danger of pricing itself out for moderate wage earners, and particularly families. Taxes, poor educational performance, congestion and signs of slowing growth are no doubt contributing factors. But the big enchilada in California — by far the largest source of distortion in living costs — is housing. Over 90 percent of the difference in costs between California’s coastal metropolises and the country derives from housing. Coastal California is affordable for roughly 15 percent of residents, down from 30 percent in 2000 and 30 percent in the interior, from nearly 60 percent in 2000. In the country as a whole, affordability hovers at roughly 60 percent.

High housing prices hurt most young, middle-class and aspiring, often minority, working-class families. California’s prices are particularly bloated, over 161 percent higher, in comparison with national averages, in the lower-end “starter home” category. In Los Angeles and the Bay Area, a monthly mortgage takes, on average, close to 40 percent of income, compared to 15 percent nationally

Over time these factors — along with prospects of reduced immigration — will impact severely the state’s future. California is already seeing its population aged 6 to 17 decline. This reflects a continued drop in fertility in comparison to less regulated, and less costly, states such as Utah, Texas and Tennessee. These areas are generally those experiencing the biggest surge in millennial populations.


Progressive or regressive?


Today even some of the state’s determined progressives understand that taking the “California model” national seems implausible when significant numbers of Californians are headed in large numbers to red Texas or purple Las Vegas. Californians are not fooled; a recent USC Downside/Los Angeles Times poll found that 17 percent believe the state’s current generation is doing better than previous ones. More than 50 percent thought younger Californians were doing worse.

The old folks are not the ones most alienated. A survey by the UCLA Luskin School suggests that 18-to-29-year-olds are the least satisfied with life in Los Angeles while seniors were most positive. In the Bay Area, according to ULI, 74 percent of millennials are considering an exodus. It appears paying high prices to live permanently as renters in dense, small apartments — the lifestyle most promoted by planners, the media and the state — may not be as attractive as advertised.

California’s media and political elites like to bask in the mirror and praise their political correctness. They focus on passing laws about banning straws, the makeup of corporate boards, prohibiting advertising for unenlightened fundamentalist preaching or staging a non-stop, largely ineffective climate change passion play. Yet what our state really needs are leaders interested in addressing more basic issues such as middle-class jobs and affordable single-family housing.

The question is not how to handle a surge of new Californians, but how to prevent a greater exodus and perhaps even de-population. If that means replacing our current densification mantra with something that meets our demographic needs, so be it.

Joel Kotkin is the R.C. Hobbs Presidential Fellow in Urban Futures at Chapman University in Orange and executive director of the Houston-based Center for Opportunity Urbanism (www.opportunityurbanism.org). Wendell Cox is principal of Demographia, a St. Louis-based public policy firm, and was appointed to three terms on the Los Angeles County Transportation Commission.


Thursday, November 1, 2018

The great family exodus

The great family exodus


Data: IPUMS-USA, University of Minnesota; Chart: Naema Ahmed/Axios 
American cities are becoming more and more unfriendly to families, and new parents are fleeing for the exurbs, where housing is more affordable and schools are better.
Why it matters: In a trend that is building its own momentum, cities are increasingly dominated by wealthy, childless residents. In the future, shifting local priorities could write kids out of urban life for good.
As the chart above shows, the share of young people under 20 years old in nearly every big city in the country has fallen over the last four decades. Zooming in, a few percentage points lost here and there seem minor. But taken together, they signal a major demographic shift in urban America.
"You're seeing [declining birth rates] in the most extreme form in cities. It's a window into a larger demographic trend where kids are few and far between."
— Stephen Mihm, economic historian at the University of Georgia
Experts chalk up the exodus of families to a number of concurrent trends:
  • "There's no doubt that a cluster of extraordinarily successful companies and the massive wealth that they've created has impacted housing prices," says Karen Harris, managing director of macro trends at Bain & Company. This is especially apparent in tech and finance hubs like San Francisco, New York and Boston.
  • "The high cost of living makes it hard for young parents to pay for the housing and living expenses of young children of school age so they move elsewhere," Terry Clark, a sociologist at the University of Chicago, tells Axios.
The result: Cities are barbells, with young, affluent and single people on one end and wealthy empty-nesters on the other, says Richard Florida, a University of Toronto urban theorist. Urban populations are constantly rotating as families move out and make way for newly-minted graduates who have disposable income to spend in bars and shops — and drive gentrification.
  • Even immigrants, who used to populate cities, are moving straight to suburbs where homes are cheaper and schools are better, Florida says.
The big picture: "Historically, cities have a hard time surviving, and much less thriving, if they must constantly replenish their populations from outside," Mihm tells Axios.
  • Big, vibrant hubs like San Francisco, Chicago or New York might not have difficulty luring scores of young people every year.
  • But smaller cities like Hartford, Cleveland, Detroit and Rochester, which are too expensive for families andhave a hard time attracting young talent suffer.
  • These four cities have seen the sharpest declines in kid population in recent years.
And if the most visible, most successful residents of cities are rich, single, young people, "schools, playgrounds and other amenities may not be funded with quite the same enthusiasm," says Mihm.
The other side: The kids haven't disappeared completely, but the families that do stay in cities are typically those that have the money to buy large homes and pay for private schools. "It's not that there aren't children in cities, it's that they're rich," says Harris."In fact, we've seen real renewals of cities with parks and museums and green spaces, but for the rich."

Friday, October 26, 2018

Why People are moving to their hometowns and starting businesses

THE GREAT RE-HOMING: WHY PEOPLE ARE MOVING BACK TO THEIR HOMETOWNS TO START SMALL BUSINESSES 

Pablo-and-Muddy-734x450.png
I have my gas station diet down pat. Coffee, water, bananas, nuts, hard-boiled eggs, and the occasional peanut butter cup indulgence. Ok, sometimes I also eat beef jerky. You have to learn these things when you spend 10,000 miles on the road talking to small business owners for a podcast.
After over 90 episodes of Small Business War Stories, a few things have happened. First, I started sucking a little less at interviewing people. Turns out it’s not as easy as it seems. But more importantly, I started noticing patterns and lessons in people’s stories. I am collecting many of those in my upcoming book.
The most interesting trend I noticed was small business entrepreneurs returning to the communities where they came from. There is an invisible shift happening where people who once wanted to spread their proverbial wings somewhere else are returning to their hometowns to make things happen. This has always been the case to some extent, but I believe that technology is enabling people to be successful in ways that were very difficult or impossible just a decade ago.
Why are people coming home? After all, at some point they left for the allure and glitz of a larger city, a greener pasture, a shinier future, a perceived better career.
Well…a few reasons:
1) Lower Cost of Living
As a wise man once said… the rent is too damn high! Most people leaving their hometowns make sacrifices in search of a career, a lifestyle, or simply to get out of the place they grew up. Adventure calls! Fortune favors the bold! 50% of your income to live in a shared shoebox? Sure! Do they take cats?
For example, Seth Lee Jones (episode 021) ventured out West to Los Angeles from Tulsa, Oklahoma in his early twenties to learn music. But when it came down to starting his own guitar-making and repair business (and his music career) in his thirties, he returned to his roots. Now he has a great house in Tulsa with a lot of history in a cool part of town for the price of a storage shed in California.
Returning to communities with a lower cost of living gives people a better chance of succeeding by keeping costs low. This can be the difference between getting through a rough patch and going back to working a dead-end job. Because of his skills and popularity on social media platforms, Seth gets customers from far and wide to buy his guitars and his music. He is selling globally, and living locally. You can check him out Monday nights at The Colony, a bar in Tulsa.
2) Community and Belonging
I believe that people can successfully build community anywhere if they set their mind and soul to it. But in my experience, it’s a bit easier in places with a bit of a slower pace of life. When there are fewer competing interests and lower stress, it’s just a little easier to stop and smile at a stranger and to remember the name of the barista who pours your coffee.
There is something special about feeling like you’re a part of the community. And it’s a bit easier to make an impact on a smaller community, especially where you grew up.
This feeling inspired another podcast guest, Cali Noland (episode 034) to move back to Clarksdale, Mississippi after college to start Meraki Coffee Roasters, and its associated non-profit, Griot Arts. Together with her business partner, Ben Lewis, Cali and Meraki roast coffee in the heart of the Mississippi Delta. But the twist is that through their business, they seek to train Delta youth in business and life skills.
Meraki sells coffee in downtown Clarksdale, but like Seth Lee Jones and his guitars, they also sell their coffee beans worldwide. They are able to make a local impact by using technology to appeal to a geographically-diverse customer base. People buy the coffee because it’s great…but also because they can make a difference in the Mississippi Delta, the birthplace of blues music and culture.
3) Technology Changes Everything
Technology is changing the way we relate to our environment. This can be bad, in the sense that it seems like everyone is on their phone all the time. But it can also be good, in the sense that it allows people to make a living pretty much anywhere.
Technology is enabling people to get more creative about how (and where) they make money. Tools such as Slack, Google Meetings, and good ol’ email allow people to collaborate with remote teams. Craftspeople can get a following on Instagram, sell their wares on Etsy, and work with a number of different on-demand shipping companies to get their products to their final destination. It’s easy to take these things for granted, but many of these tasks were much more difficult, if not impossible, as little as a decade ago.
The development of technology will continue to create flexible opportunities. From distance learning, to even more remote office connectivity, to deeper broadband Internet reach, the future is bright for people with initiative and flexibility. That means more opportunities for people to live where they want and do what they like.
I have a strong intuition that this trend will continue over the next few decades. States like Vermont are piggybacking on this trend by offering people $10,000 to move there. Smaller communities will continue to attract people with their lower cost of living, higher quality of life, and an inviting environment to thrive as small businesses and as involved members of their communities.
In the meanwhile, I’ll continue to drive far and wide in search of good stories for the podcast; I never cease to be amazed by what I learn from the small business owners and operators who make up the heartbeat of America.
Pablo Fuentes is the Founder and CEO of Proven, a company that helps small businesses hire with easy-to-use software. He is proud of his company’s blog, which helps small businesses with fun things like finding the Best Small Business Podcasts, and useful but less fun things like finding the Best Applicant Tracking System

Sunday, October 21, 2018

What is Middle-Income Housing Affordability?


What is Middle-Income Housing Affordability? 

by Wendell Cox


Few local or metropolitan issues receive more attention than housing affordability. This article provides a perspective on housing affordability. The focus is on the approach used by the Demographia International Housing Affordability Survey, which I co-author annually with Hugh Pavletich (of performanceurbanplanning.org). The Demographia Survey has been published for 14 years. This edition includes housing affordability data and ratings for nearly 300 cities (metropolitan areas) in nine nations (Note 1).
What is Housing Affordability?

Housing affordability is the relationship between housing costs and income. Affordability can only be evaluated if there is a comparison to income. Yet, analysts and journalists often use refer to house prices or rents or their increases without relation to incomes to describe housing affordability. Prices are not an indicator of affordability if they are not compared to incomes but have only anecdotal value. Nor are house price or rent trends an indicator of affordability without comparison to incomes.
What is Middle-Income Housing Affordability?

Middle-income housing affordability is important, because affordable access to quality housing has been pivotal to the democratization of prosperity that occurred in the last century in most high-income nations. Normally, the competitive market has provided middle-income housing without the need for subsidies.

Middle-income is different from low – income housing (also called “affordable housing” or “social housing”), which relies on public subsidies to serve the needs of households unable to afford the house prices or rents prevailing on the open market. Focusing on middle-income does not indicate a lesser interest in low-income housing, because subsidy eligibility requirements are tied to house prices. Better housing affordability translates into fewer households seeking housing subsidies through affordable housing programs (and less public expense).

There are two principal dimensions of middle-income housing affordability — between housing markets and within individual market over time.
Owned and Rented Housing Affordability

Housing affordability can be measured for both owned and rented housing. Price-to-income ratios are typical for owned housing, including the “median multiple” used in the Demographia Survey (below). Percentage of incomes spent on rents are often used to evaluate rental housing affordability.

The Importance of Middle-Income Housing Affordability


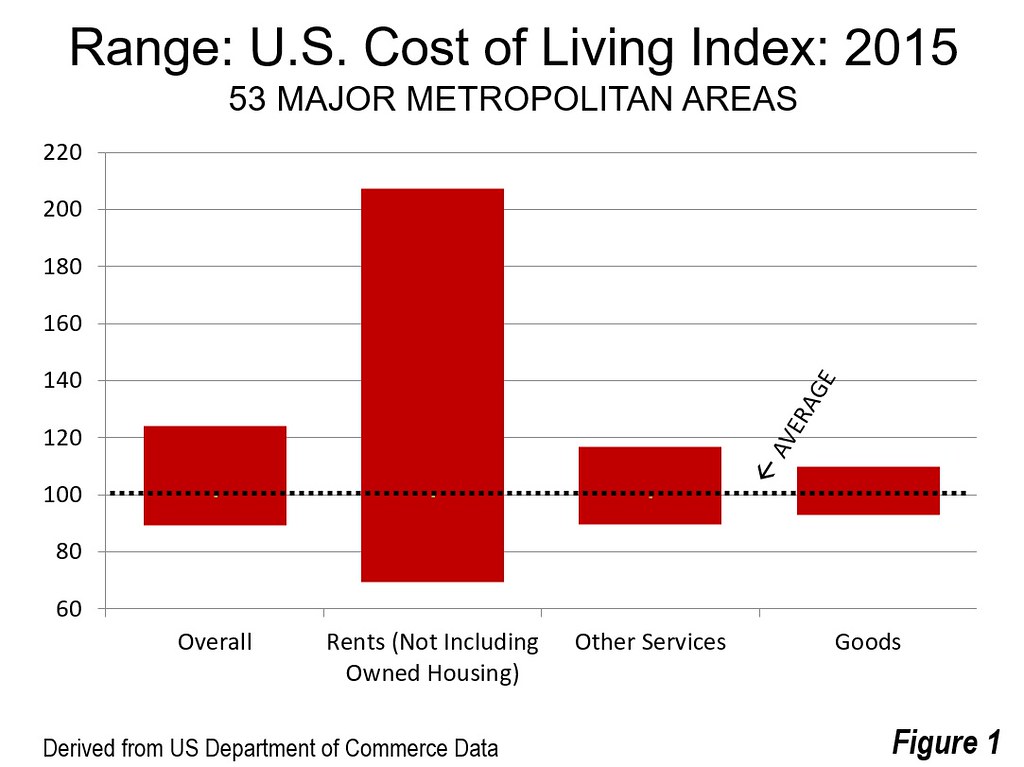
Housing is usually the largest budget item for households. The differences in housing costs between major metropolitan areas now increasingly drive differences in the costs of living. Housing costs also vary far more in their high to low range than in the other two major expenditure categories, according to the US Bureau of Economic Analysis, which are services not including rents and goods. (Figure 1).

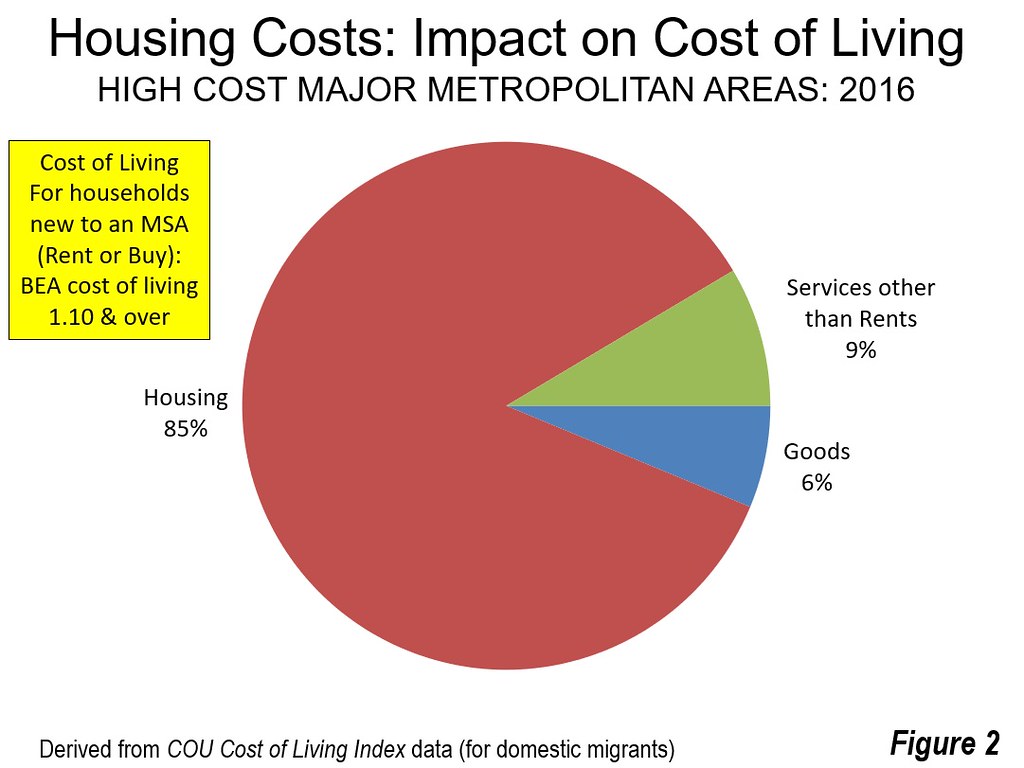
The differences are even greater when the costs of owned housing are included, as is illustrated by the COU “movers” cost of living index. This index estimates the cost of living for a domestic migrant household moving into the housing market and captures both the differences in rental and owned housing affordability. It is estimated that in the high-cost markets, 85 percent of the higher cost of living stems from higher housing costs (Figure 2).

Middle-income housing affordability is also important to the economy. Paul Cheshire of the London School of Economics and Wouter Vermeulen of VU University wrote, “… [h]ousing being the dominant asset in most households’ portfolios, there are also repercussions on saving, investment and consumption choices.” Where housing is more affordable, households will have more discretionary income to purchase additional goods and services and to save (which generates investment). All of this can contribute to job creation and a stronger economy.

Not only do higher house prices lead to a lower standard of living, but can also increase poverty. For example, California has the highest housing cost adjusted poverty rate among the 50 states of the United States, at 20.4%. This compares to California’s 14.5% rate without adjustment for housing costs.


Owned Housing Affordability Metrics


One of the most utilized owned housing affordability metrics is the price-to-income ratio. A United Nations publication indicated:


“If there is a single indicator that conveys the greatest amount of information on the overall performance of housing markets, it is the house price-to-income ratio. It is obviously a key measure of housing affordability. When housing prices are high relative to incomes, other things being equal, a smaller fraction of the population will be able to purchase housing.”

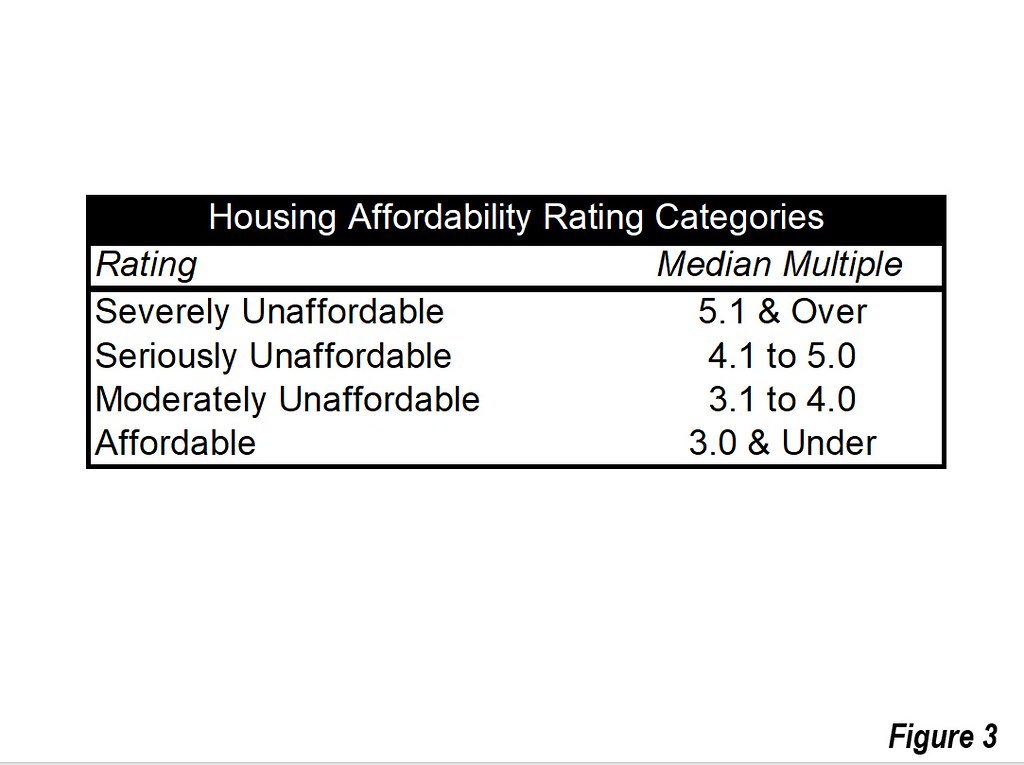
The Demographia International Housing Affordability Survey uses the median multiple (median house price divided by median household income). The evaluation criteria is in Figure 3.


The Geography of Housing Affordability


Demographia evaluates housing affordability between housing markets: Housing markets are coterminous with labor markets (metropolitan areas). Within housing markets, there will typically be a large urban area, which is defined an expanse of contiguous built-up land (see Demographia World Urban Areas). The area beyond the urban periphery is defined as the urban fringe, which is generally the land between the principal urban area and the boundaries of the metropolitan area. Typically, the urban fringe contains virtually all of the greenfield (undeveloped) land that can be used for new housing. Much of the growth of urban areas that has occurred since World War II in Australia, Canada, New Zealand, and the United States has been in detached housing tracts in greenfield areas.

Thus, for example, the New York housing market includes the entire New York metropolitan area, which stretches from Montauk Point on Long Island (east) to Pike County, Pennsylvania (west) to Ocean County, New Jersey (south) and to Dutchess County (north). The city of New York and other municipalities are only parts of the New York housing market.

Housing affordability may also be evaluated within a housing market. For example, the housing affordability in Brooklyn can be compared to that of White Plains. Or, housing affordability can be compared between more local neighborhoods, like Rainier Valley and Ballard in Seattle. Demographia evaluates housing affordability only at the housing market level and thus does not evaluate housing affordability between areas within housing markets.

The Time Dimension of Housing Affordability


The other important housing affordability comparison is historical, or over time. Thus, housing affordability may be compared for the same or multiple housing markets between 2000 and 2017.
The Need for Clarity

As many cities evaluated by Demographia suffer severe housing affordability, evaluations need to be conducted with sufficient clarity. Serious housing affordability evaluation requires comparison that includes incomes, as well as comparisons between housing markets and over time. In fact, much of the nation remains affordable by historic standards — severe unaffordability is limited to a minority of markets. The public is misled by analyses that fail to include both prices and incomes (See related article: “Housing Affordability from Vancouver to Sydney and Toronto: Time to Do What Works“).

Note 1: Metropolitan areas are “economic cities,” generally not related to the physical jurisdictions of cities as local government authorities, which may be larger or smaller than metropolitan areas.

Note 2: Parts of this article are adapted from published materials I have authored or co-authored.


Wendell Cox is principal of Demographia, an international public policy and demographics firm. He is a Senior Fellow of the Center for Opportunity Urbanism (US), Senior Fellow for Housing Affordability and Municipal Policy for the Frontier Centre for Public Policy (Canada), and a member of the Board of Advisors of the Center for Demographics and Policy at Chapman University (California). He is co-author of the “Demographia International Housing Affordability Survey” and author of “Demographia World Urban Areas” and “War on the Dream: How Anti-Sprawl Policy Threatens the Quality of Life.” He was appointed to three terms on the Los Angeles County Transportation Commission, where he served with the leading city and county leadership as the only non-elected member. He served as a visiting professor at the Conservatoire National des Arts et Metiers, a national university in Paris

Wednesday, June 6, 2018

Income, Employment and Housing information for Lucas Valley-Marinwood

Lucas Valley-Marinwood, California


  • OSM Map
  •  
  • General Map
  •  
  • Google Map
  •  
  • MSN Map
Leaflet | Data, imagery and map information provided by CartoDBOpenStreetMapand contributors, CC-BY-SA
Clear, Hot
81°F
10 miles
Wind: Wind from WSW 18 mph
Pressure: 29.87 in
Humidity: 30%
Population in 2010: 6,094. Population change since 2000: -4.1%
Males: 2,726  (44.7%)
Females: 3,368  (55.3%)
Median resident age:  49.1 years
California median age:  36.4 years
Zip codes: 94903.
Estimated median household income in 2016: $123,347 (it was $85,444 in 2000)
Lucas Valley-Marinwood:
$123,347
CA:
$67,739

Estimated per capita income in 2016: $59,341 (it was $38,423 in 2000)

Lucas Valley-Marinwood CDP income, earnings, and wages data

Saturday, December 30, 2017

"Housing Crisis" or bubble ?? California Net Migration -556,710

"Housing Crisis" or bubble ??


California Net Migration -556,710


"The latest population estimates indicate that the long-term movement to the South and West is continuing. Of course, the biggest exception in the West remains its largest state, California, which has become one of the nation's largest exporters of people since the 1990s."


http://www.newgeography.com/content/005837-the-migration-millions-2017-state-population-estimates


THE MIGRATION OF MILLIONS: 2017 STATE POPULATION ESTIMATES


by Wendell Cox 12/30/2017


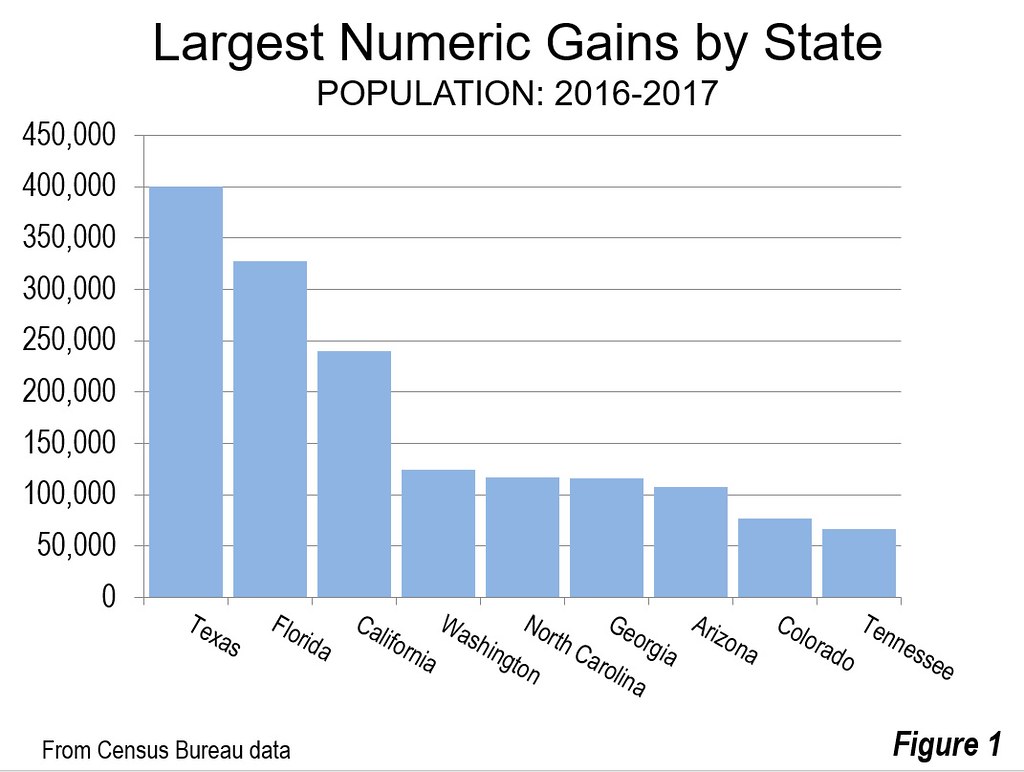
Texas added the most new residents of any state over the past year according to the July 1, 2017 estimates of the United States Census Bureau. Texas grew by 400,000 residents (Figure 1). Florida added 328,000 residents more than one third more than California. Four states grew between 100,000 to 125,000, led by Washington, North Carolina, Georgia and Arizona. Colorado and Tennessee round out the top 10. The ten states adding the most new residents include five from the South census region and five from the West census region.


Population Growth

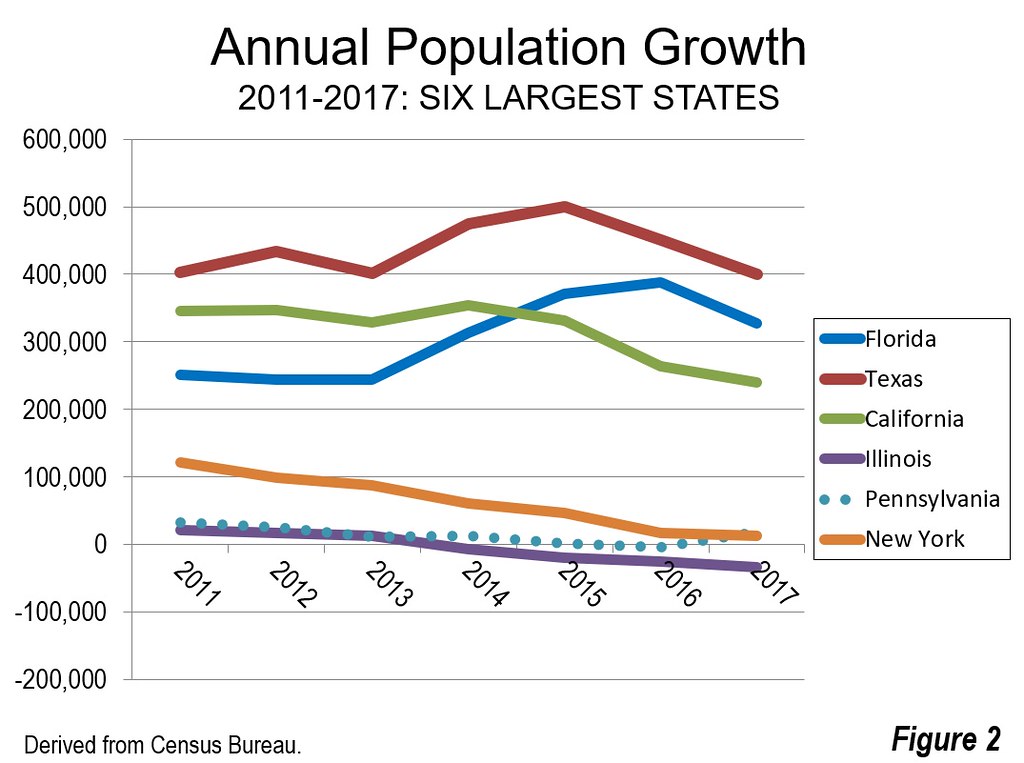
Over this decade, the three largest states have dominated numeric population growth. Texas has led the nation in each of the seven years, though has experienced declines in growth over the last two due likely to the instability in petroleum markets. Since 2010, Texas has added 3.1 million residents, more than live in 18 states and the District of Columbia. California has added 2.2 million new residents since 2010, edging out Florida. California's growth, however, has dropped significantly, to 240,000 between 2016 and 2017 the smallest number since the late 1990s. California's growth in this decade had peaked in 2014 at more than 350,000, but has since dropped by nearly one quarter. Florida added 2.1 million new residents and has led California in each of the last three years.

The other three largest states did much more poorly. New York has dropped from a gain of over 120,000 in 2011 to only 13,000 in 2017. Illinois has done even more poorly, dropping from the 21,000 gain in 2011 to a loss of 33,000 in 2017. Illinois has experienced a reduction in its growth each year of this decade.

Illinois Drops a Notch: Further, Illinois in 2017 lost its long standing hold on the fifth-largest position to Pennsylvania. Pennsylvania's ascendancy reverses a development in the 1950s, when Illinois passed Pennsylvania to become the third largest state. Less than a decade earlier, Pennsylvania had been passed by California, relinquishing its second ranking, which it had held since the 1810 census. Later, Illinois had been passed in the 1970s by Texas and in the following decade by Florida. (Figure 2).


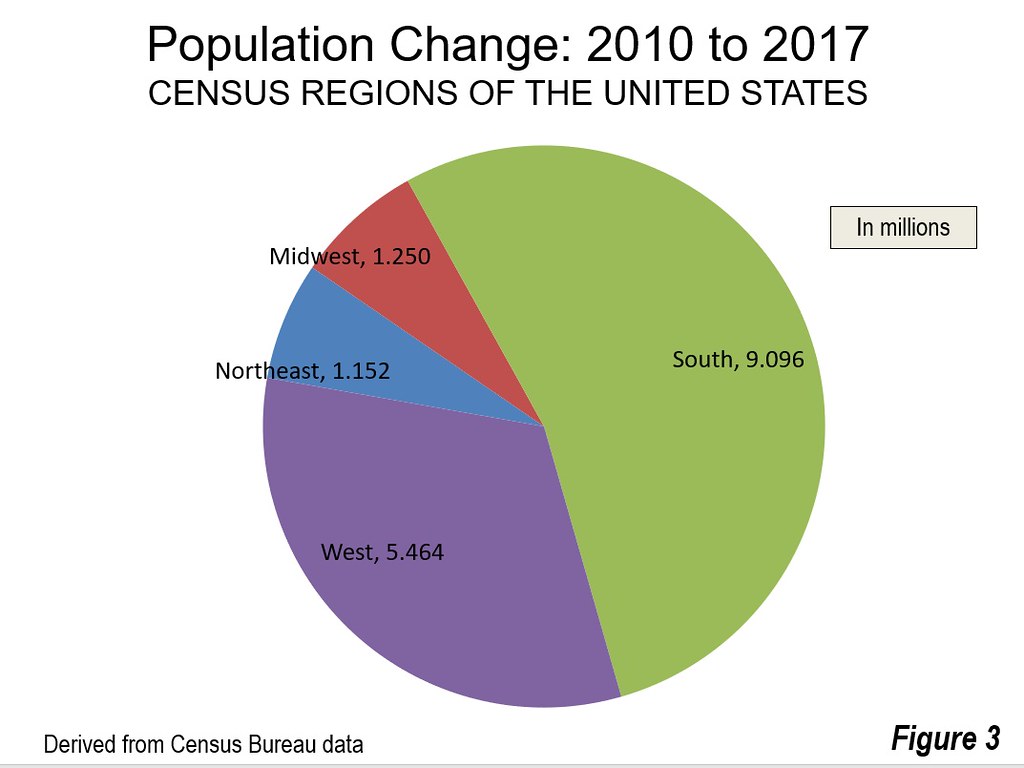
The South census region has dominated US population growth throughout the decade. Between 2010 and 2017, the South added 9.1 million new residents or 54% of the national growth. This compares to the West, which also grew strongly but added millions fewer (5.5 million new residents). The West accounted for 32% of the national growth. The Midwest and Northeast continue to lag, each taking 7% of the national growth (Figure 3).


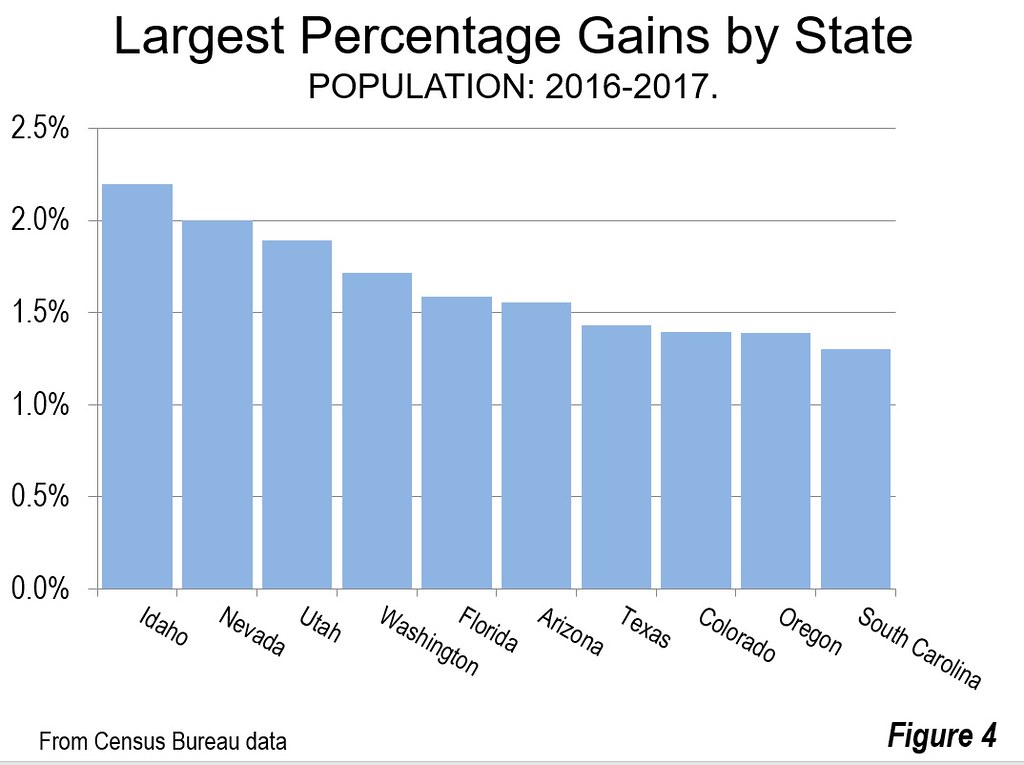
Idaho experienced the largest proportional growth rate in 2007, at 2.2%. Idaho was followed closely by its neighbors, Nevada at 2.0% and Utah at 1.9%. The next four positions were taken by large or medium sized states, including Washington at 1.7%, Florida and Arizona at 1.6% and Texas at 1.4%. Colorado and Oregon grew at 1.4%, followed by South Carolina at 1.3% (Figure 4).


Where the Millions are Moving

Despite the fact that interstate migration stands at a lower rate than in recent decades, millions of people continue to cross state lines seeking new residences. From 2010 to 2017, the number was 4.3 million. Domestic migration has been dominated by the South and West census regions, consistent with their dominance of population growth.

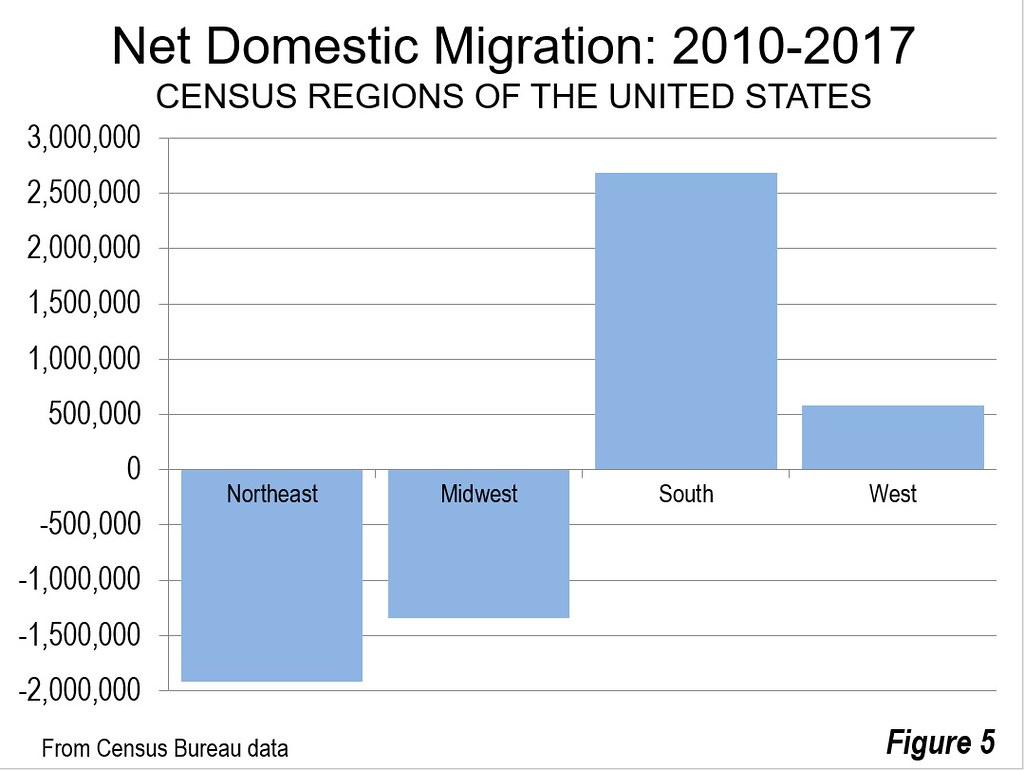
The South census region had a net domestic migration gain of 2.7 million residents. The West census region had a gain of 600,000 net domestic migrants, far short of the number in the South. In contrast, a net 1.9 million residents left the Northeast for other census regions, while 1.3 million left the Midwest for elsewhere (Figure 5). Even so, as indicated above, the Northeast and Midwest continue to grow as a result of in migration from other countries and natural growth (births minus deaths).


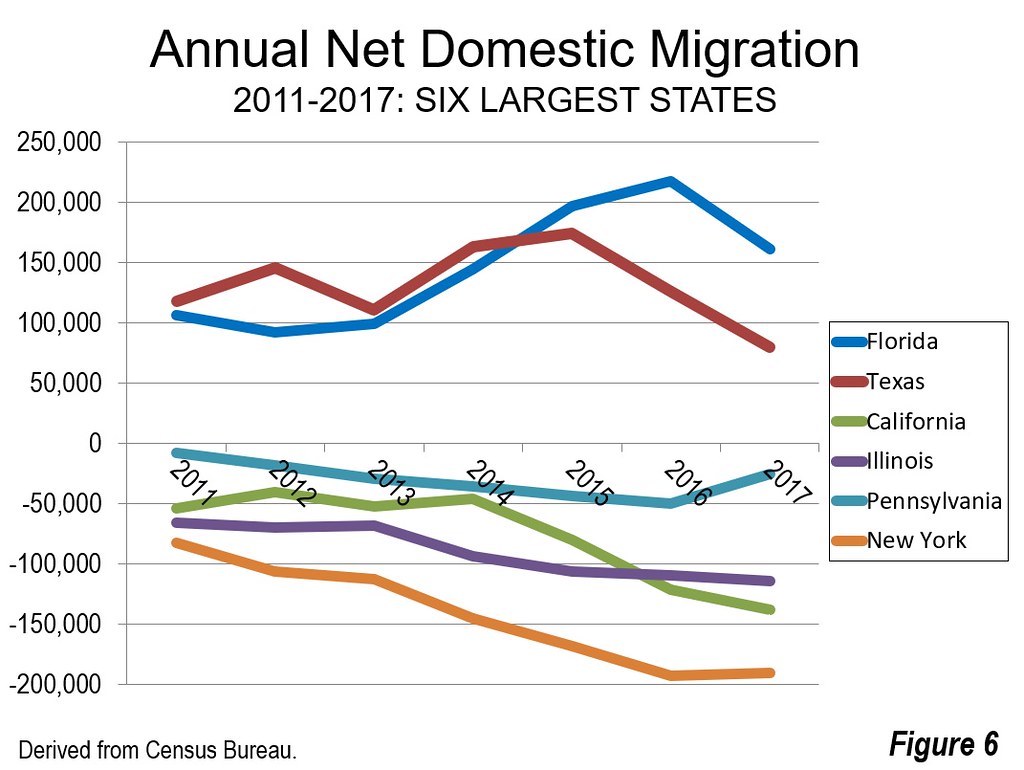
The six largest states experienced significantly different net domestic migration results. Florida has led in net domestic migration, adding 1.025 million residents from other states since 2010. Florida has also led in three of the seven years. Texas led in the first four years of the decade and has added 945,000 net domestic migrants.

Among the other four largest states, the net domestic migration losses have been substantial. The smallest loss has been in Pennsylvania at approximately 215,000. California has lost approximately 545,000 net domestic migrants since 2010, a pattern that has accelerated in recent years. Just three years ago (2014), California had lost fewer than 50,000 net domestic migrants. By 2017, outward net migration had escalated to nearly 140,000. In the first five years of the decade, California had done less poorly in net domestic migration than Illinois. However, in each of the last two years, California has lost more net domestic migrants than Illinois.

Illinois has lost the second largest number of net domestic migrants, at more than 640,000. The losses have escalated from below 75,000 in each of the first three years of the decade to nearly 115,000 in 2017. New York hemorrhaged by far the largest number of net domestic migrants, more than 1,020,000. In each of the last two years, New York has lost approximately 190,000 net domestic migrants, well above its early 80,000 loss in 2011. (Figure 6).


Dominance of the South (and West)

The latest population estimates indicate that the long-term movement to the South and West is continuing. Of course, the biggest exception in the West remains its largest state, California, which has become one of the nation's largest exporters of people since the 1990s. In contrast, Arizona, Washington, Colorado, Oregon, Nevada have attracted large numbers of people. In the South, most states have been gaining domestic migrants, though there are exceptions, especially Maryland, Virginia, West Virginia and Mississippi. But overall the South has been dominant. In each of the last seven years, the South has been the destination for more than 70 percent of US net domestic migration.

The data is summarized in the Table below.


State Population Estimates
2010 - 2017
State & DC April 1, 2010 July 1, 2017 Change % Net Domestic Migration
Alabama 4,785,579 4,874,747 89,168 1.9% 1,153
Alaska 714,015 739,795 25,780 3.6% -37,492
Arizona 6,407,002 7,016,270 609,268 9.5% 278,290
Arkansas 2,921,737 3,004,279 82,542 2.8% 7,222
California 37,327,690 39,536,653 2,208,963 5.9% -556,710
Colorado 5,048,029 5,607,154 559,125 11.1% 276,485
Connecticut 3,580,171 3,588,184 8,013 0.2% -153,276
Delaware 899,712 961,939 62,227 6.9% 25,824
District of Columbia 605,040 693,972 88,932 14.7% 30,787
Florida 18,846,461 20,984,400 2,137,939 11.3% 1,025,261
Georgia 9,712,696 10,429,379 716,683 7.4% 163,536
Hawaii 1,363,817 1,427,538 63,721 4.7% -42,456
Idaho 1,570,912 1,716,943 146,031 9.3% 61,332
Illinois 12,841,196 12,802,023 -39,173 -0.3% -642,821
Indiana 6,490,029 6,666,818 176,789 2.7% -57,864
Iowa 3,050,223 3,145,711 95,488 3.1% -17,695
Kansas 2,858,403 2,913,123 54,720 1.9% -83,158
Kentucky 4,347,948 4,454,189 106,241 2.4% -12,593
Louisiana 4,544,871 4,684,333 139,462 3.1% -47,701
Maine 1,327,568 1,335,907 8,339 0.6% 3,968
Maryland 5,788,099 6,052,177 264,078 4.6% -112,092
Massachusetts 6,564,943 6,859,819 294,876 4.5% -98,948
Michigan 9,876,731 9,962,311 85,580 0.9% -225,302
Minnesota 5,310,711 5,576,606 265,895 5.0% -32,518
Mississippi 2,970,437 2,984,100 13,663 0.5% -59,667
Missouri 5,995,681 6,113,532 117,851 2.0% -57,375
Montana 990,507 1,050,493 59,986 6.1% 37,304
Nebraska 1,829,956 1,920,076 90,120 4.9% -12,289
Nevada 2,702,797 2,998,039 295,242 10.9% 145,131
New Hampshire 1,316,700 1,342,795 26,095 2.0% 2,875
New Jersey 8,803,708 9,005,644 201,936 2.3% -395,160
New Mexico 2,064,607 2,088,070 23,463 1.1% -55,903
New York 19,405,185 19,849,399 444,214 2.3% -1,022,071
North Carolina 9,574,247 10,273,419 699,172 7.3% 327,631
North Dakota 674,518 755,393 80,875 12.0% 39,178
Ohio 11,539,282 11,658,609 119,327 1.0% -192,615
Oklahoma 3,759,529 3,930,864 171,335 4.6% 28,125
Oregon 3,837,073 4,142,776 305,703 8.0% 181,252
Pennsylvania 12,711,063 12,805,537 94,474 0.7% -214,426
Rhode Island 1,053,169 1,059,639 6,470 0.6% -33,615
South Carolina 4,635,834 5,024,369 388,535 8.4% 264,781
South Dakota 816,227 869,666 53,439 6.5% 11,890
Tennessee 6,355,882 6,715,984 360,102 5.7% 178,125
Texas 25,241,648 28,304,596 3,062,948 12.1% 944,018
Utah 2,775,260 3,101,833 326,573 11.8% 50,162
Vermont 625,842 623,657 -2,185 -0.3% -10,179
Virginia 8,025,206 8,470,020 444,814 5.5% -53,500
Washington 6,741,386 7,405,743 664,357 9.9% 249,052
West Virginia 1,854,315 1,815,857 -38,458 -2.1% -28,380
Wisconsin 5,690,403 5,795,483 105,080 1.8% -68,738
Wyoming 564,376 579,315 14,939 2.6% -8,838
Source: U.S. Census Bureau


Wendell Cox is principal of Demographia, an international public policy and demographics firm. He is a Senior Fellow of the Center for Opportunity Urbanism (US), Senior Fellow for Housing Affordability and Municipal Policy for the Frontier Centre for Public Policy (Canada), and a member of the Board of Advisors of the Center for Demographics and Policy at Chapman University (California). He is co-author of the "Demographia International Housing Affordability Survey" and author of "Demographia World Urban Areas" and "War on the Dream: How Anti-Sprawl Policy Threatens the Quality of Life." He was appointed to three terms on the Los Angeles County Transportation Commission, where he served with the leading city and county leadership as the only non-elected member. He served as a visiting professor at the Conservatoire National des Arts et Metiers, a national university in Paris.

Monday, July 10, 2017

Leaving California? After slowing, the trend intensifies

Leaving California? After slowing, the trend intensifies


By JOEL KOTKIN and WENDELL COX |
PUBLISHED: April 24, 2017 at 5:34 am | UPDATED: April 24, 2017 at 11:58 am


Given its iconic hold on the American imagination, the idea that more Americans are leaving California than coming breaches our own sense of uniqueness and promise. Yet, even as the economy has recovered, notably in the Bay Area and in pockets along the coast, the latest U.S. Census Bureau estimates show that domestic migrants continue to leave the state more rapidly than they enter it.

First, the good news. People may be leaving California, but, overall, the rate of leaving is about three-quarters less than that experienced in the first decade of the millennium. In the core, booming San Francisco metropolitan area, there was even a shift toward net domestic migration after 2010, something rarely seen since the 1980s.

Outmigration dropped with the initial economic slowdown of the last recession, particularly as housing prices in some areas, notably the Inland Empire and the Sacramento area, drifted toward the national norm of three times incomes by 2010, having been twice that high or more in the boom times. The initial recovery after 2010 may also have encouraged people to stay as well.
The San Francisco Bay Area lost more than 600,000 net domestic migrants between 2000 and 2009 before experiencing a five-year respite. Now, sadly, the story seems to be changing again. Housing prices, first in the Bay Area and later in other metropolitan areas, have surged mightily, and are now as high as over nine times household incomes. In 2016, some 26,000 more people left the Bay Area than arrived. San Francisco net migration went from a high of 16,000 positive in 2013 to 12,000 negative three years later.

Similar patterns have occurred across the state. Between 2010 and 2015, California had cut its average annual migration losses annually from 160,000 to 50,000, but that number surged last year to nearly 110,000. Losses in the Los Angeles-Orange County area have gone from 42,000 in 2011 to 88,000 this year. San Diego, where domestic migration turned positive in 2011 and 2012, is now losing around 8,000 net migrants annually.

The major exceptions to this trend can be found in the somewhat more affordable interior regions. Sacramento has gained net migration from barely 1,800 in 2011 to 12,000 last year. Even some still-struggling areas, like Modesto and Stockton, have seen some demographic resurgence as people move farther from the high-priced Bay Area.

CALIFORNIA AND THE NEW DEMOGRAPHIC REALITY


The movement away from expensive core regions reflects the basic preference among people for affordable, less dense housing. The new Census estimates have confirmed this national trend. Migration to both suburbs and smaller cities — and away from dense core counties — is now at the highest rate in a decade.

Population growth in big urban core cities, including New York, is now about half of what it was back in 2010. Last year, all 10 of the top gainers in domestic migration were sprawling, more affordable Sun Belt metropolitan areas in states like Texas, North Carolina, Florida and Tennessee.

These dispersive trends are clear in Southern California, where net migration out of Los Angeles County runs about four times the rate of neighboring, more suburban Orange County, as migration to places like Riverside County mounts. Despite all the national hype surrounding L.A.’s drive for densification, it’s not a model that most people, and particularly families, seem to be embracing.


CALIFORNIA’S CHOICE


The apparent growing appetite for suburban living presents a unique challenge to California. The state policy is aggressively anti-suburban, placing ever-higher hurdles on any development on the periphery. This, over time, is slowing construction in the interior and forcing housing prices unnaturally up, even in these areas.

Some so-called progressives hail these trends, as forcing what they seem to see as less desirable elements — that is, working- and middle-class people — out of the state. They allege that this is balanced out by a surge of highly educated workers coming to California. Essentially, the model is that of a gated community, with a convenient servant base nearby.

Yet, in reality, this may prove to be wishful thinking. A dive into Internal Revenue Service data shows distinctly that, while poor people are, indeed, leaving, the largest group of outmigrants tends to be middle-aged people making between $100,000 and $200,000 annually. They may not be ideal algorithm creators for Facebook, but they do constitute the solid middle ranks critical to any healthy economy.

Indeed, since 2010, the Golden State has seen an overall net outflow of $36 billion from these migrants (and that counts only the first year of income). The biggest gainers from this exchange are where Californians are moving, to such places as Texas, Arizona and Nevada. That some California employers are joining them in the same places should be something of a two-minute warning for state officials.

But California leaders have other things on their minds that do not include accommodating the aspirations of residents who refuse to abandon suburban homes, or who are unwilling to desert their cars for the pleasures of mass transit. Until Californians demand a government that reflects their aspirations, too many people will continue to have to seek their futures elsewhere, to the detriment to those who remain behind.

Joel Kotkin is the R.C. Hobbs Presidential Fellow in Urban Futures at Chapman University in Orange and executive director of the Houston-based Center for Opportunity Urbanism (www.opportunityurbanism.org). Wendell Cox is principal of Demographia, a St. Louis-based public policy firm, and was appointed to three terms on the Los Angeles County Transportation Commission.
Monday, July 3, 2017

FLIGHT FROM URBAN CORES ACCELERATES: 2016 CENSUS METROPOLITAN AREA ESTIMATES

FLIGHT FROM URBAN CORES ACCELERATES: 2016 CENSUS METROPOLITAN AREA ESTIMATES

coral-gables-cox.jpg
The flight from the nation’s major metropolitan area core counties increased 60 percent between 2015 and 2016, according to just-released estimates from the US Census Bureau (Note). A total of 321,000 more residents left the core counties than moved in, up from 199,000 in 2015. This is ten times the decade’s smallest domestic migration loss of 32,000 for the same counties which occurred in 2012.
Suburban counties continued to attract net domestic migrants, at a somewhat higher rate than in recent years and much higher than in the early part of the decade. The suburban counties gained 235,000 domestic migrants in 2016, compared to 224,000 in 2014 and more than double the low point of 113,000 in 2011 (Figure 1).

Wednesday, January 11, 2017

Marin’s population continues to grow at slow pace


Marin’s population continues to grow at slow pace


Youth groups walk to the midway at the Marin County Fair. People are having fewer children in California.
Youth groups walk to the midway at the Marin County Fair. People are having fewer children in California.Robert Tong — Marin Independent Journal


When it comes to population growth, Marin continues to be among the slowest-growing counties in the state while participating in a statewide trend toward lower birth rates.
Marin’s population increased by 1,152 people, or 0.4 percent, between July 1, 2015, and July 1, 2016, according to state Department of Finance statistics released last week. Thirty-three of California’s 58 counties grew at a faster rate. Yolo County led the field with a 1.97 percent growth rate, and the state as a whole grew at a 0.75 percent rate, to more than 39 million people.
The report also showed that California’s birth rate dipped to an historic low in 2015-16, a trend demographers say is driven largely by millennials putting off parenthood to finish college and launch careers.
The state’s birth rate declined to 12.42 births per 1,000 population in 2016 — the lowest in California history, according to the report. In 2010, the last time figures were compiled, the birth rate was 13.69 per 1,000 population.
“There are a lot of people who could be having children but are choosing to do something else,” said Walter Schwarm, a demographer with the Department of Finance. “People want to establish careers. They’re looking to pursue degrees, they’re getting out there and finding their place in employment.”
But as young people opt to start families between ages 30 to 34, they find it’s “harder and harder to conceive,” according to Schwarm.
The fact that people are having fewer children may also be an indication that “the economy is not as strong as we hoped it would be,” said Professor Josh Goldstein, chairman of the University of California at Berkeley’s Department of Demography.
“It’s clear that fertility rates went down when the economy got worse,” Goldstein said. “Demographers are still noticing that birth rates have not picked up as the economic measures have improved.”
The number of births in Marin has declined since the onset of the Great Recession in 2009; births at Marin General Hospital declined from 1,627 in 2008 to 1,322 in 2015.
The state’s death rate also increased slightly in 2015-16 to 6.71 deaths per 1,000 population, compared with 6.26 in 2010 as members of the baby-boom generation grow older.
There were 2,286 births in Marin in 2015-16 compared with 2,016 deaths for a net increase of 270 residents. The bulk of the county’s population increase came from 726 foreign immigrants, while 156 people migrated to Marin from other states.
Marin’s 0.4 percent growth rate, the same as in 2014-15, is its slowest in the past six years. Marin population grew by 0.5 percent in 2011-12, 0.9 percent in 2010-11, 1 percent in 2013-14 and 1.1 percent in 2012-13.
Population growth projections became a hotly debated subject in 2013 when Plan Bay Area — a long-range transportation and land-use/housing blueprint for the nine-county Bay Area — was adopted. Critics of the plan challenged the plan’s projection that Marin would gain some 33,000 new residents by 2040. They pointed to a Department of Finance projection that Marin’s population would grow by just 6,818 residents by 2040.
If Marin were to add the same number of new residents as it did in 2015-16 over the next 24 years, by 2040 it would have added 27,648 new residents.
The new population data doesn’t break out population by municipality. But previously released numbers covering population growth from Jan. 1, 2015, to Jan. 1, 2016, showed Novato leading the way in Marin with 458 new residents, a 0.8 percent growth rate, for a total population of 54,749.
Marin’s most populous city, San Rafael, grew at a 0.1 percent rate, adding 75 residents for a total population of 60,582. Larkspur had Marin’s second-fastest growth rate, 0.6 percent, adding 74 residents for a total population of 12,445. Fairfax, the only Marin municipality to contract, lost seven residents during the period.
The Bay Area News Group contributed to this report.
MARIN BIRTHS
Births at Marin General Hospital, 2002 to 2015
2002: 1,737
2003: 1,910
2004: 1,792
2005: 1,767
2006: 1,656
2007: 1,781
2008: 1,627
2009: 1,541
2010: 1,414
2011: 1,368
2012: 1,400
2013: 1,345
2014: 1,416
2015: 1,322
Source: Office of Statewide Health Planning and Development

Monday, June 6, 2016

One-third of Bay Area residents hope to leave soon, poll finds

One-third of Bay Area residents hope to leave soon, poll finds

By George Avalos, gavalos@bayareanewsgroup.com POSTED: 05/02/2016


More than one-third of Bay Area residents say they are ready to leave in the next few years, citing high housing costs and traffic as the region's biggest problems, according to a poll released Monday.

Of the 1,000 people polled by the Bay Area Council, 34 percent said they are considering leaving. Those who have lived here five years or less are the most likely to want to leave.

"This is our canary in a coal mine," said Jim Wunderman, president of the Bay Area Council. "Residents are screaming for solutions."

In another grim result, the number of residents who believe the region is on the wrong track has increased sharply in the past year, the poll found.

This year's poll found that 40 percent of respondents felt the Bay Area was on the wrong track, while 40 percent felt it was headed in the right direction. Just one year ago, only 28 percent felt the Bay Area was on the wrong track, and 55 percent thought it was headed in the right direction.

"This survey underscores that we have a choice," said Carl Guardino, president of the Silicon Valley Leadership Group, which is pushing to raise sales taxes by a half-cent in Santa Clara, San Benito, Santa Cruz and San Francisco counties to fund transportation. "We can be enraged, or we can be engaged. We can engage the broader community on solutions that actually tackle these seemingly insurmountable problems."

Among the solutions that have been proposed is creating high-density housing close to job hubs, along transit corridors or in both locations.

Some observers say the Bay Area's challenges, which have arrived amid the job boom in the tech hubs of Silicon Valley, is pushing low- and middle-income people out and could transform the region into a Manhattan-like megalopolis.
"The economic divide in the Bay Area is real," said Russell Hancock, president of Joint Venture Silicon Valley. "We will lose low-income earners, and they will be replaced by high earners. We are losing the middle class as well."

People in Santa Clara County and San Francisco are feeling the least optimistic about the direction of the Bay Area.

Just 37 percent of Santa Clara County residents believe the Bay Area is headed in the right direction, and only 33 percent of San Francisco residents think the region is on the right track. What's more, 52 percent of San Francisco residents say the Bay Area is on the wrong track.

Optimistic and pessimistic attitudes didn't vary much by income group.

Among people with household incomes of $125,000 a year or more, 46 percent said the region was on the right track, while 40 percent said it was on the wrong track. Among those with incomes ranging from $75,000 to $125,000, 42 percent said the Bay Area was on the right track, while 38 percent said it was on the wrong track. And among those with less than $75,000 in household income, 38 percent said the Bay Area is going in the right direction, while 43 percent said it's on the wrong track.

The survey also found that people who spend more of their money on housing were more likely to seek an escape from the Bay Area in the next few years.

Despite the number of respondents who said they're ready to go, 54 percent said they had no plans to defect from the Bay Area.

"We can whine about this, or we can win by solving our traffic and housing problems," Guardino said. "The last time the Bay Area had seemingly solved its traffic problems was the worldwide recession of 2008. A recession is not how we want to solve our traffic and housing problems."